
Weekly Market Overview February 13, 2022
Feb 12, 2022If you have followed my work for any period of time you know that I am highly focused on market regimes to help guide my strategies.
Market regimes tell me what the environment is like, is the market volatile or calm, is it directionally bullish or bearish?
My most researched method is a quantitative statistical method using a formula that averages the daily % price change of the last 100 trading days, the SQN formula.
Using this method, the $SPX (S&P 500 Index) is trading in the Neutral market regime.
The Neutral market regime has some key characteristics, most notably, the underlying market will tend to chop around in a range, making overshoots above and below the range, sucking everyone in to thinking the markets are breaking out, or breaking down, only to quickly reverse back to the range.
This is a 4 hour chart of $SPX in 2022, you can clearly see the major selloff that really kicked in to gear mid January and since then has been trading back and forth on major strength, weakness, strength, weakness with a bunch of chop around the middle. 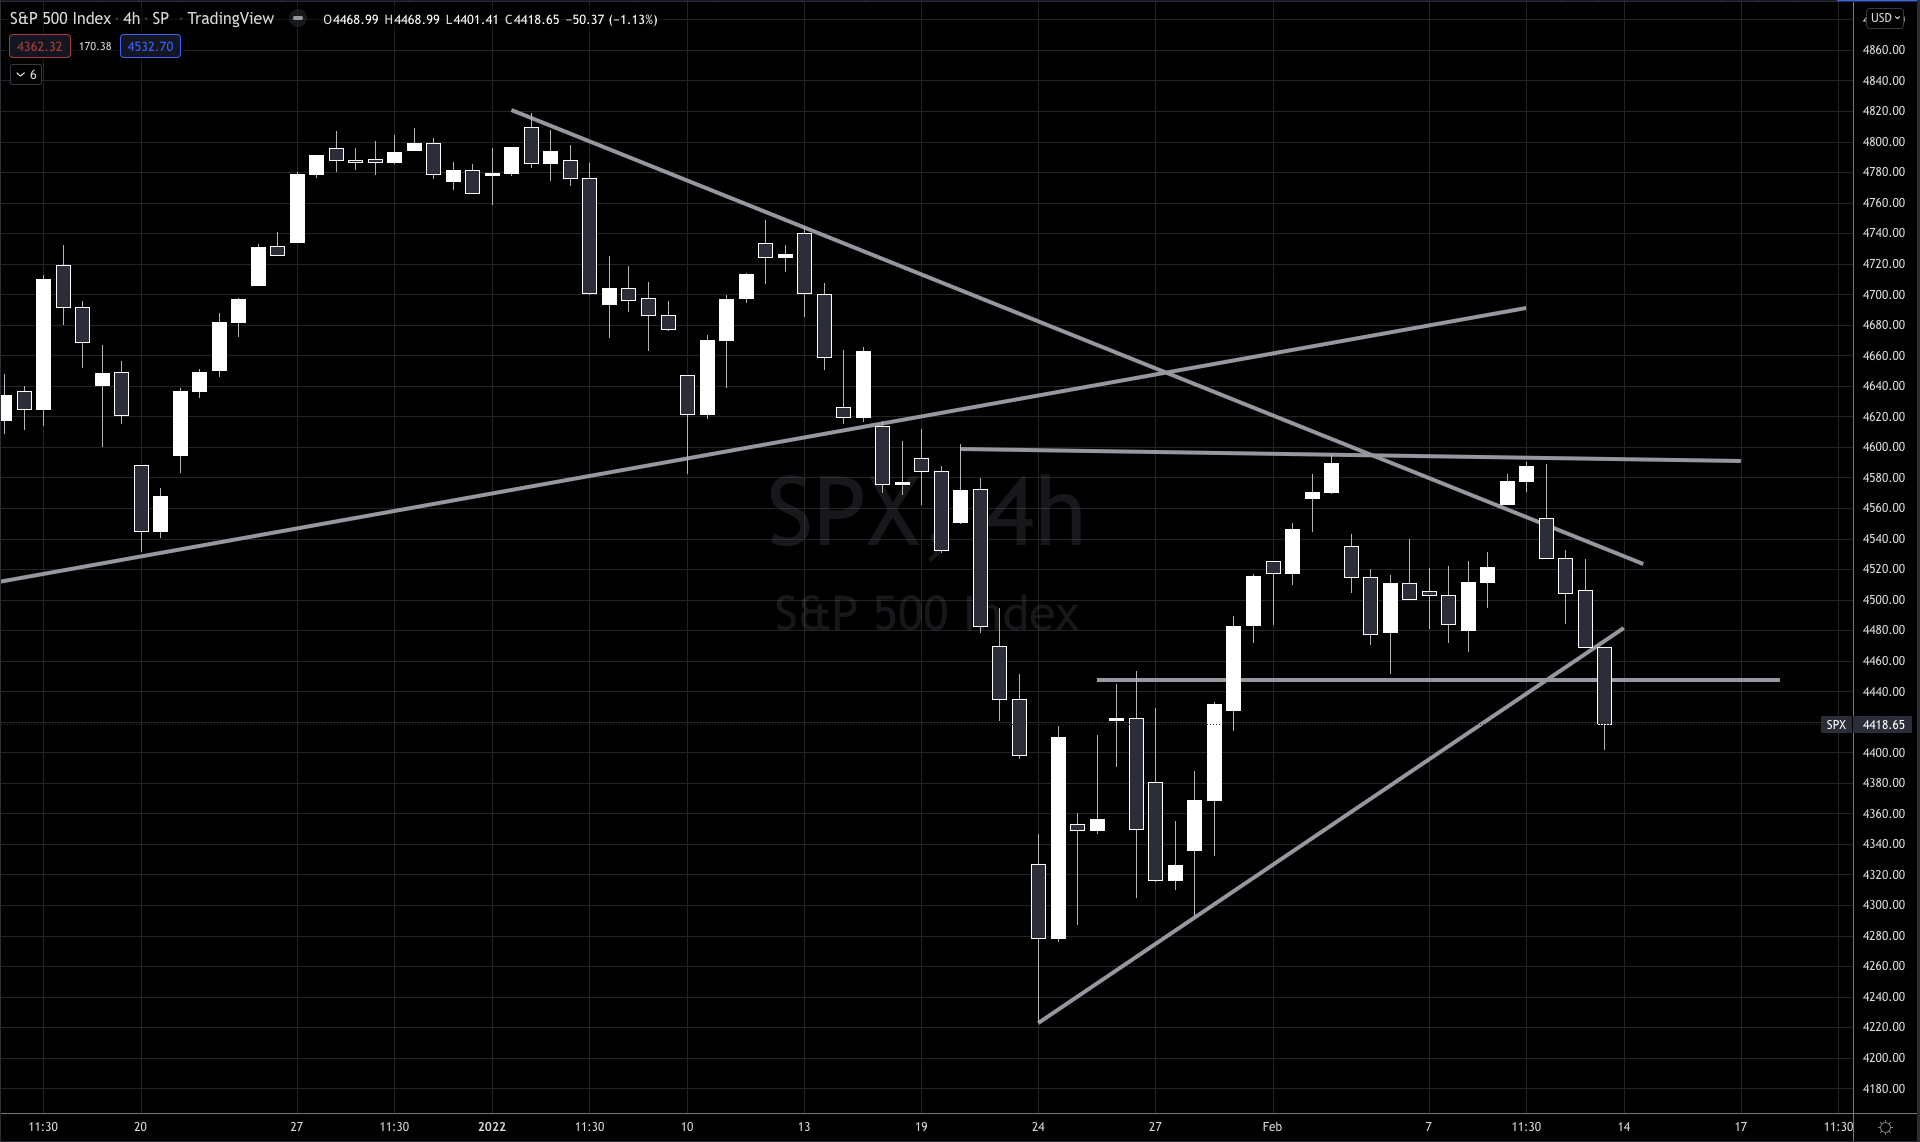
Clearly the market regime is neutral, as no directional bias is obvious yet, and also volatile as the daily changes are well over 1 to 2% up or down in any given day.
For day traders, this is a wonderful environment to trade long/short intraday using mean reversion strategies and trend following short term strategies to catch runners.
- If you are active trading during the day, you should check out the Trading Lab. Each morning I publish a daily briefing about what i'm looking at that trading day, key levels on Futures, I also look at different swing trades I'm looking to get in that day/week.
- We livestream for a couple hours during the trading day, going over markets, looking at trades, taking trades, covering the different trading strategies, mentoring, teaching and shooting ideas off each other.
- In our Slack Channel, I post my trades in real time during the day, along with any swing trades I have put on.
If you are a swing trader, holding for days/weeks, this environment in equities is different than it was a month or two ago. What worked in 2021, isn't what is working in 2022.
I'll get to what is working exceptionally in this market in a little bit, but first, the most important chart in the world right now... to me.
The High Yield Corporate Bond ETF $HYG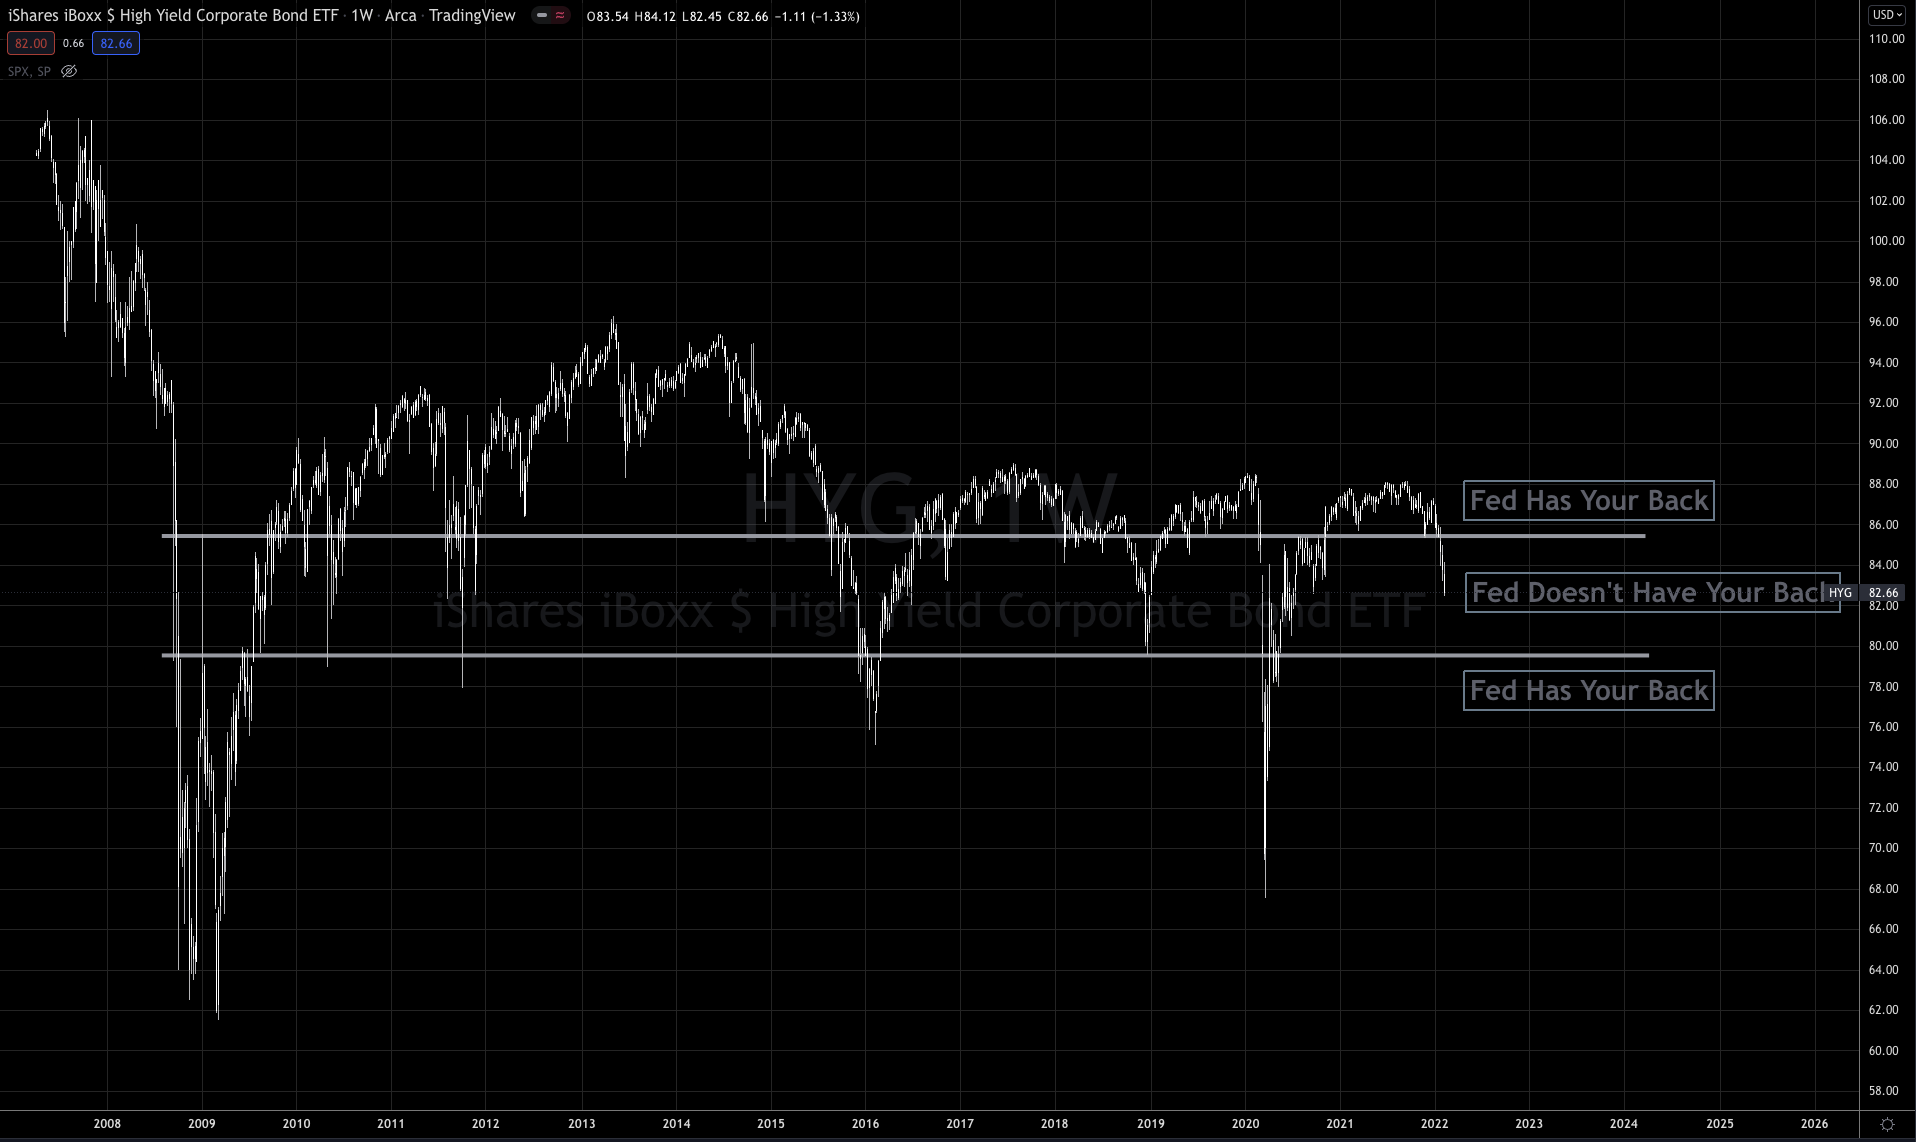
You might have heard of the "Fed Put". This refers to the Federal Reserve stepping in when markets sell off to lower interest rates or increase their buying of debt. While partially true, the real put that the Fed has is the High Yield Corporate Credit markets.
When times are prosperous, and the markets rally forward, the High Yield Debt markets operate flawlessly, so that business intelligence software companies can raise billions of dollars by selling bonds to buy Bitcoin, for example. If credit markets weren't operating so well, there's no way that Micro Strategy could have done what they did there.
When credit markets operate flawlessly, equity markets rage higher!
But when equity markets take a turn lower, that doesn't mean credit markets are at risk.
Clearly in the $HYG chart we can see that when prices are above $86 on the ETF that it is a wonderful time to trade bull mode in equities.
When $HYG trades below $86, equities flip to bear mode quickly. In that environment, don't expect the Federal Reserve or anyone else to save you.
This is where we are right now, and we saw the first signs of this the end of November.
During the normal ebbs and flows of equity markets, the $HYG will move down around the $86 levels, and we typically see 5-10% pullbacks in the Equity Indices, we bottom and power on to new all time highs.
But when that $86 level breaks, that means something worse is happening and the Fed is definitely paying attention.
That's where we are today.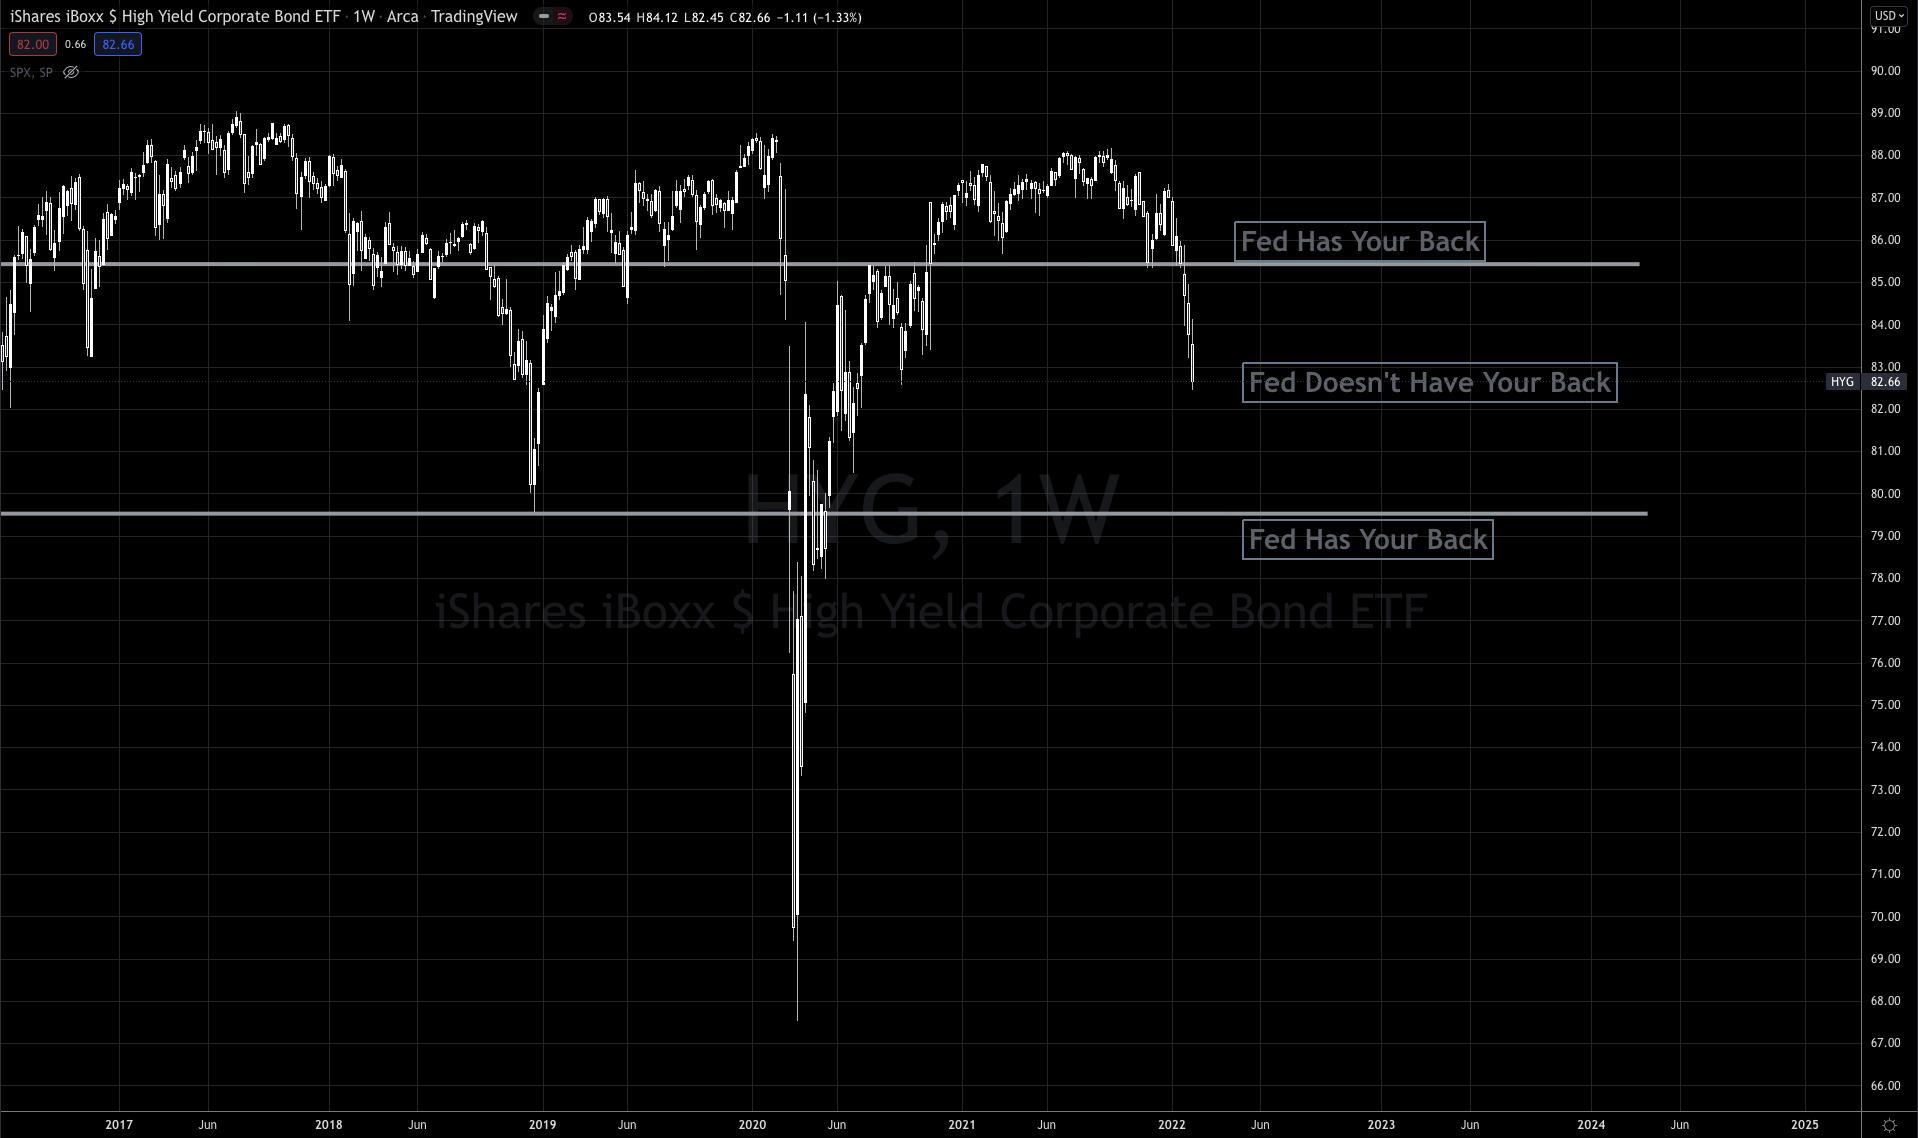
When the $HYG moves to $80 level that's when the Fed steps in to support equity and credit markets with rate drops and buying up assets.
Sometimes this $80 level gets overshot, such as during the March 2020 Covid selloff, or in 2015/2016 when the Fed ended quantitative easing and raised rates aggressively or the Global Financial Crisis in 2008/2009.
Other times, when it has held, such as December 2018 when we last were faced with equities selling off hard, crashing and reversing on Christmas Day, the $80 level held and we kicked off a wonderful recovery in equities.
What was different in 2015/2016 was that the Yield Curve (2's/10's) was at a safe level relative to previous inflection points in the markets.
We are a perhaps month away (maybe sooner, maybe later) from being at yet another inflection point with stress caused by less credit.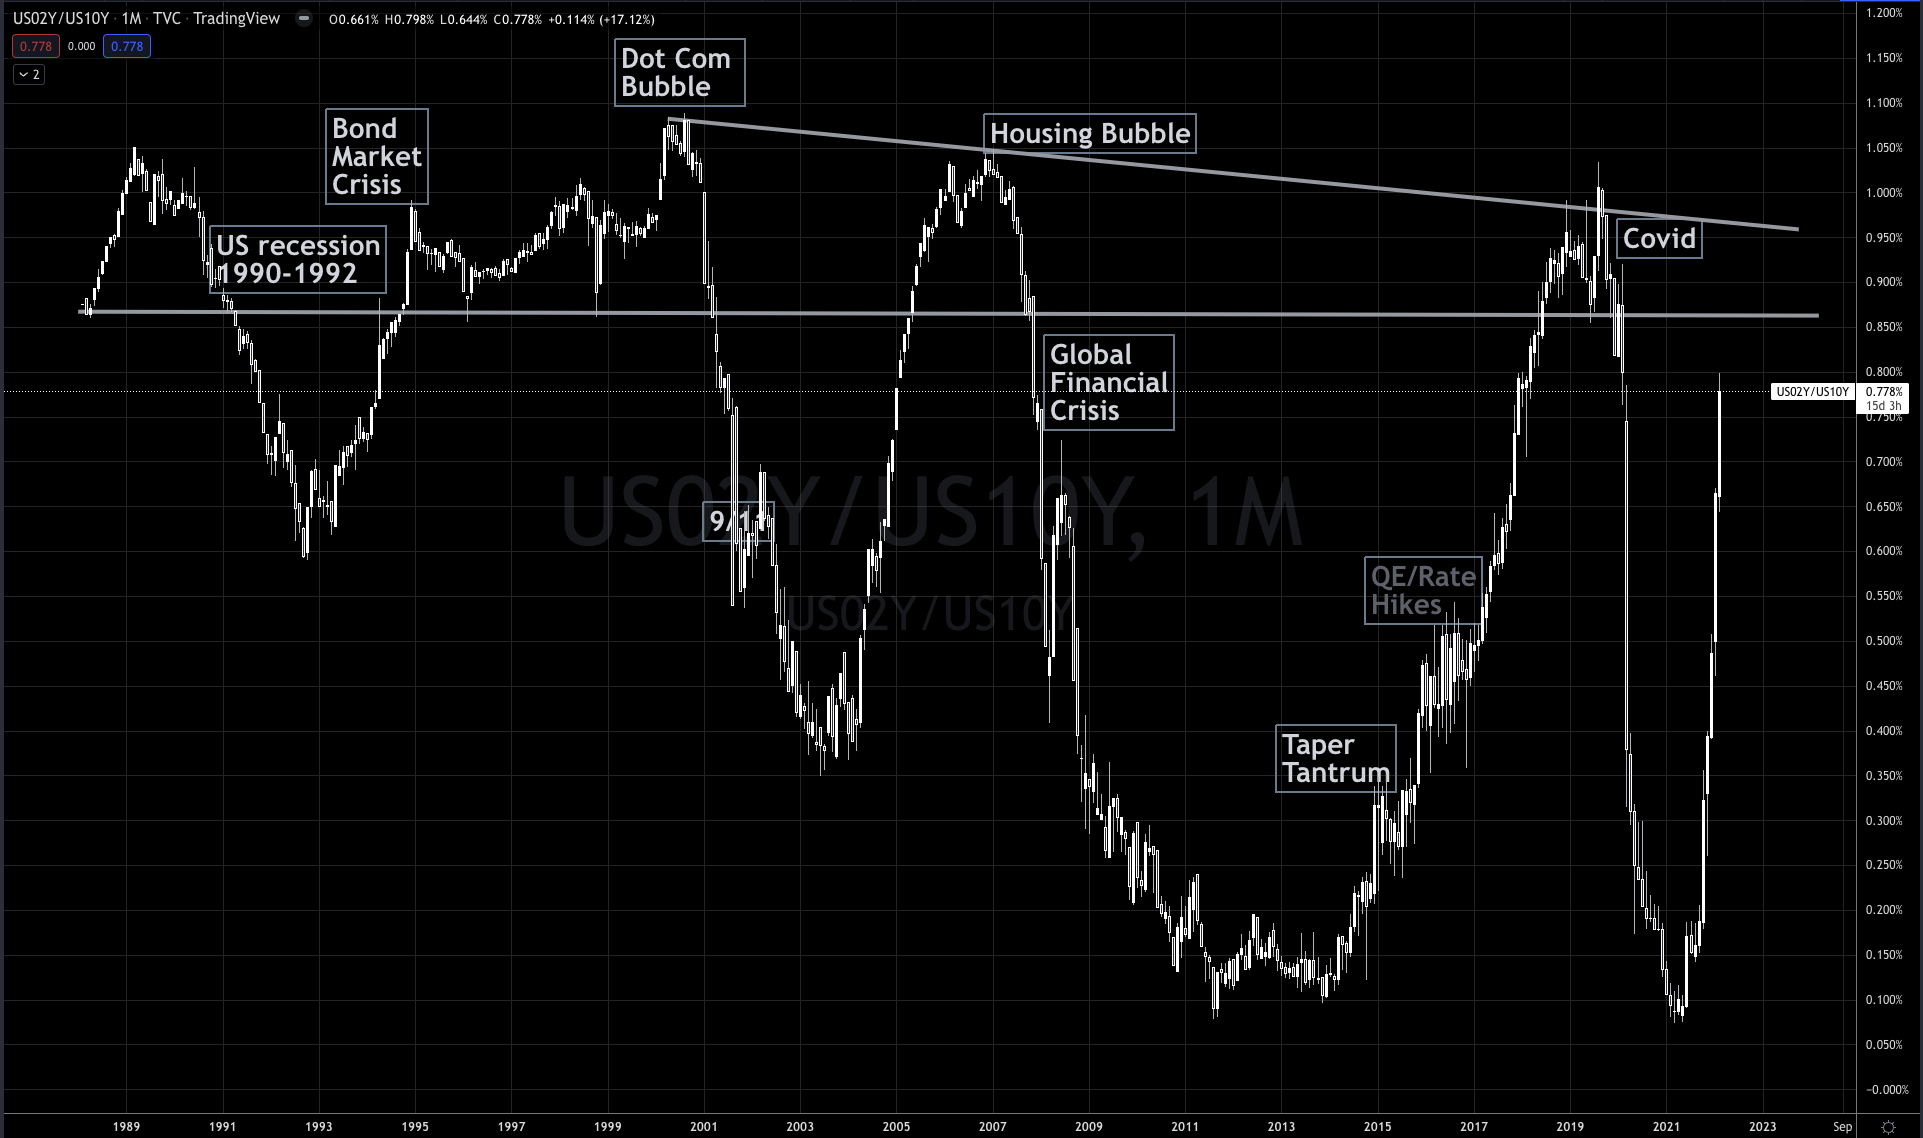
The velocity, or rate of change in the curve is truly dramatic, mirroring the velocity at which it dropped during the Covid crisis.
I'd say the door is open for an emergency rate hike or any number of measures by the Federal Reserve BEFORE the March meeting.
I have no clue what to expect the next crisis to be, but we are close to that $80 $HYG level and only 20% off the key 2/10 1.00% levels that have signaled major risk in markets, and society.
The Fed will want to have some dry ammo to use if this major risk event happens.
Also, yes I'm aware that these magic price levels are somewhat meaningless as a number themselves, but nonetheless they seem to be rather important to keep an eye on.
On to what is working exceptionally...
Energy, particularly Crude Oil based businesses.
While the $SPX is down 8% and $NDX (Nasdaq 100) is down over 13% so far in 2022, the $XLE (SPIDR Energy ETF) is up over 23% in the same amount of time.
The only sector that is even positive on the year are Financials, who benefit from higher rates, but no where near as strong as Energy. 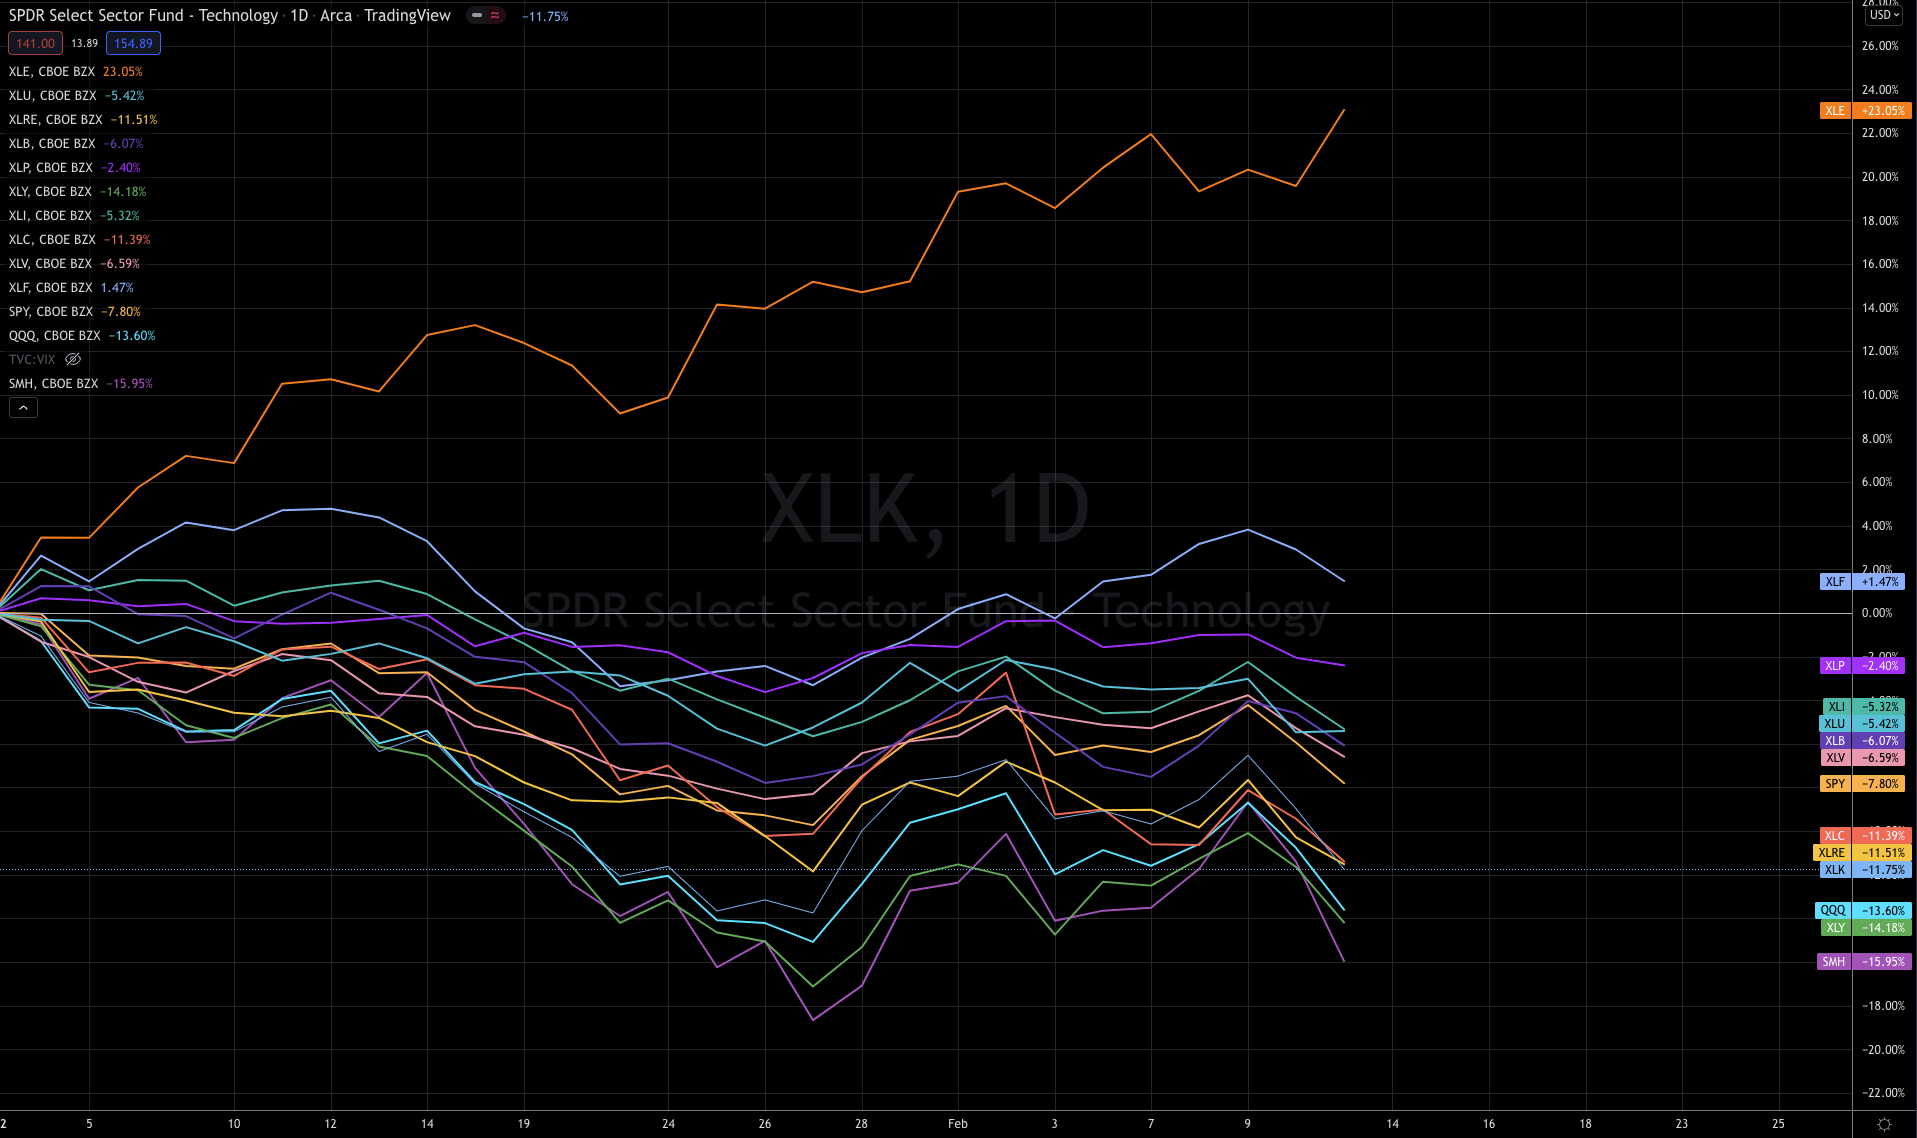
There are a number of big names that are in big trends and seem to be a target for a lot of big money looking for a home.
A number of excellent Swing Beast Momentum trades have been paying exceptionally this year in this sector in companies like $HAL, $CVX, $XOM, $SLB and $COP, not to mention the $XLE ETF itself.
The Swing Beast Strategy got long $CL (Crude Oil Futures) at around $74 in December, and as of Friday $CL traded over $94 and hasn't closed the trading day below the 10 day simple moving average.
That is the definition of a strong move!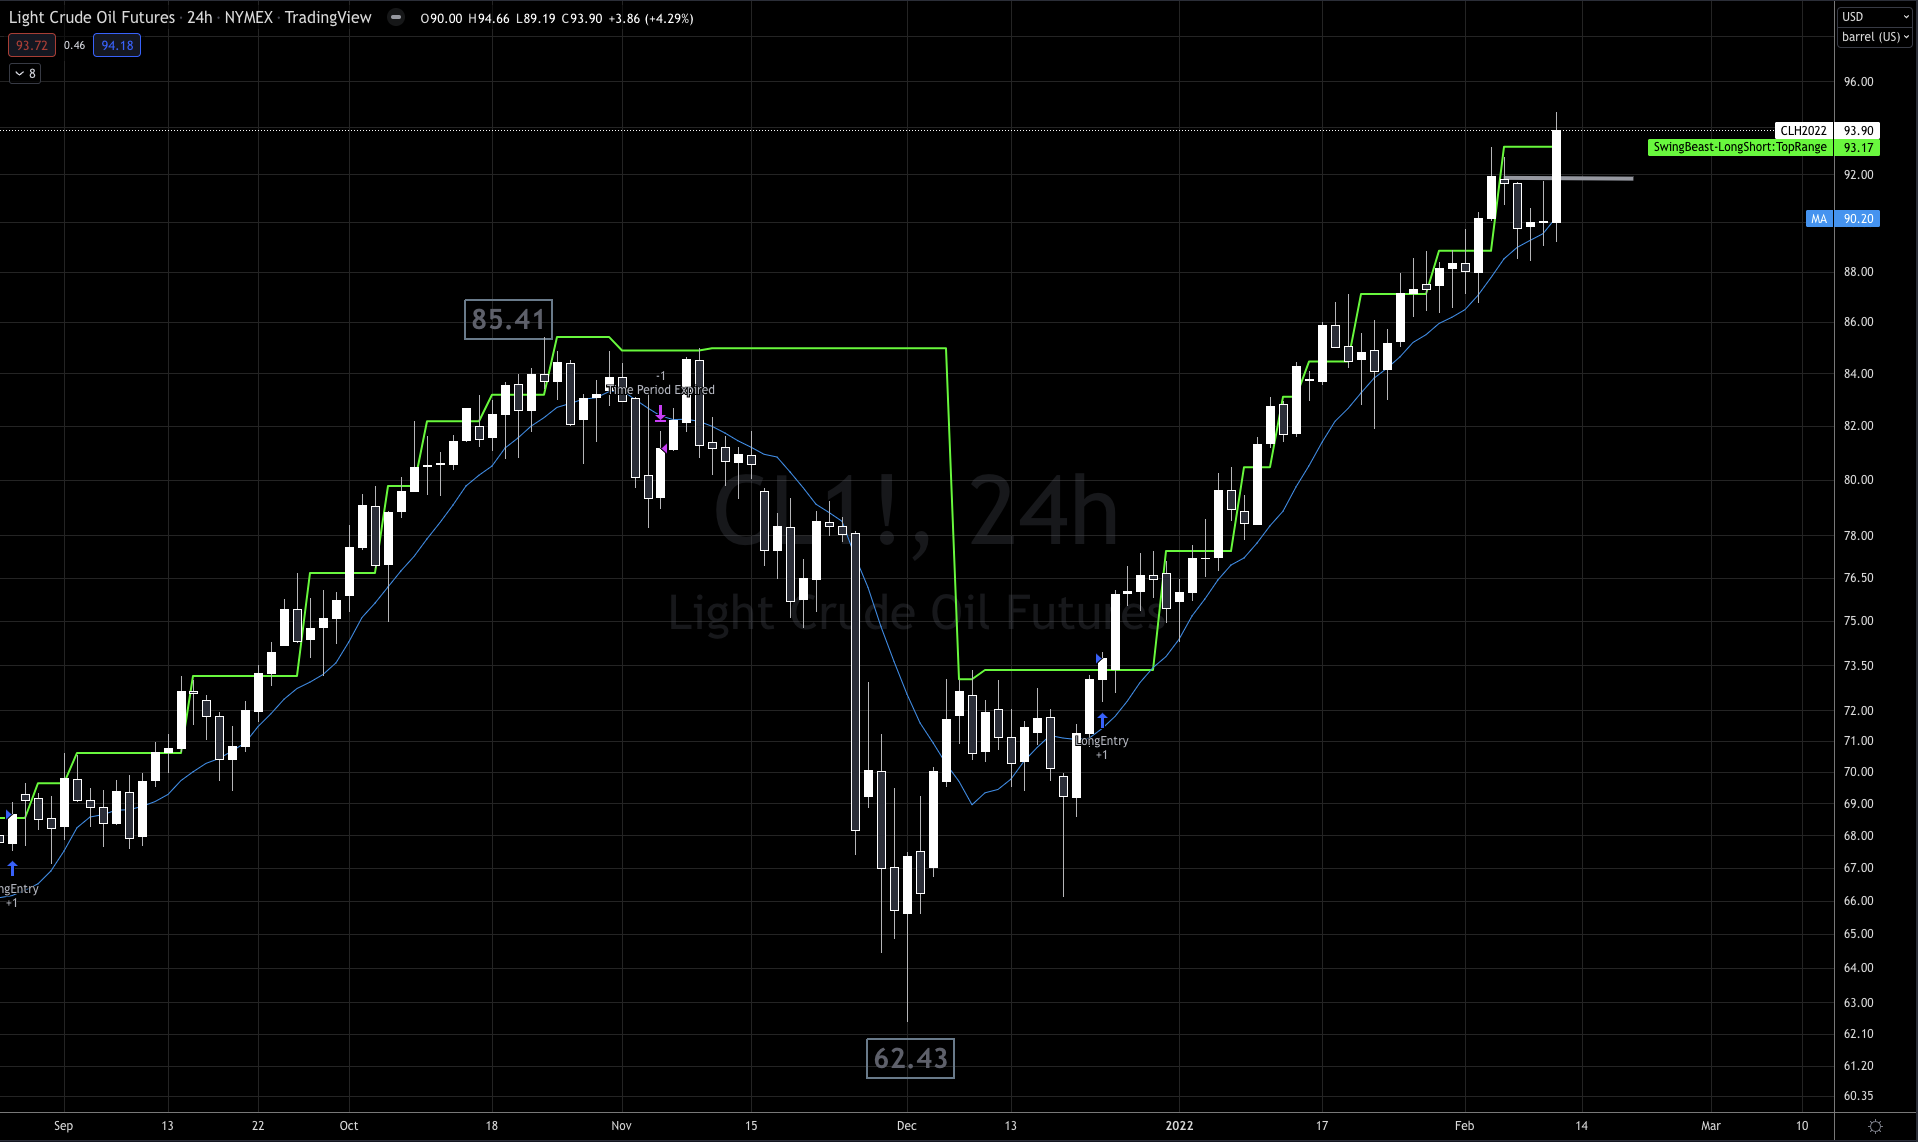
We will be looking at taking further Swing Beast trades in the Energy stocks this week in the Trading Lab.
Last week we got long $GC (Gold Futures) off of a FBOR setup (Failed Breakout Retest) at 1816 levels, watching Gold push to the 1860+ levels by Friday. 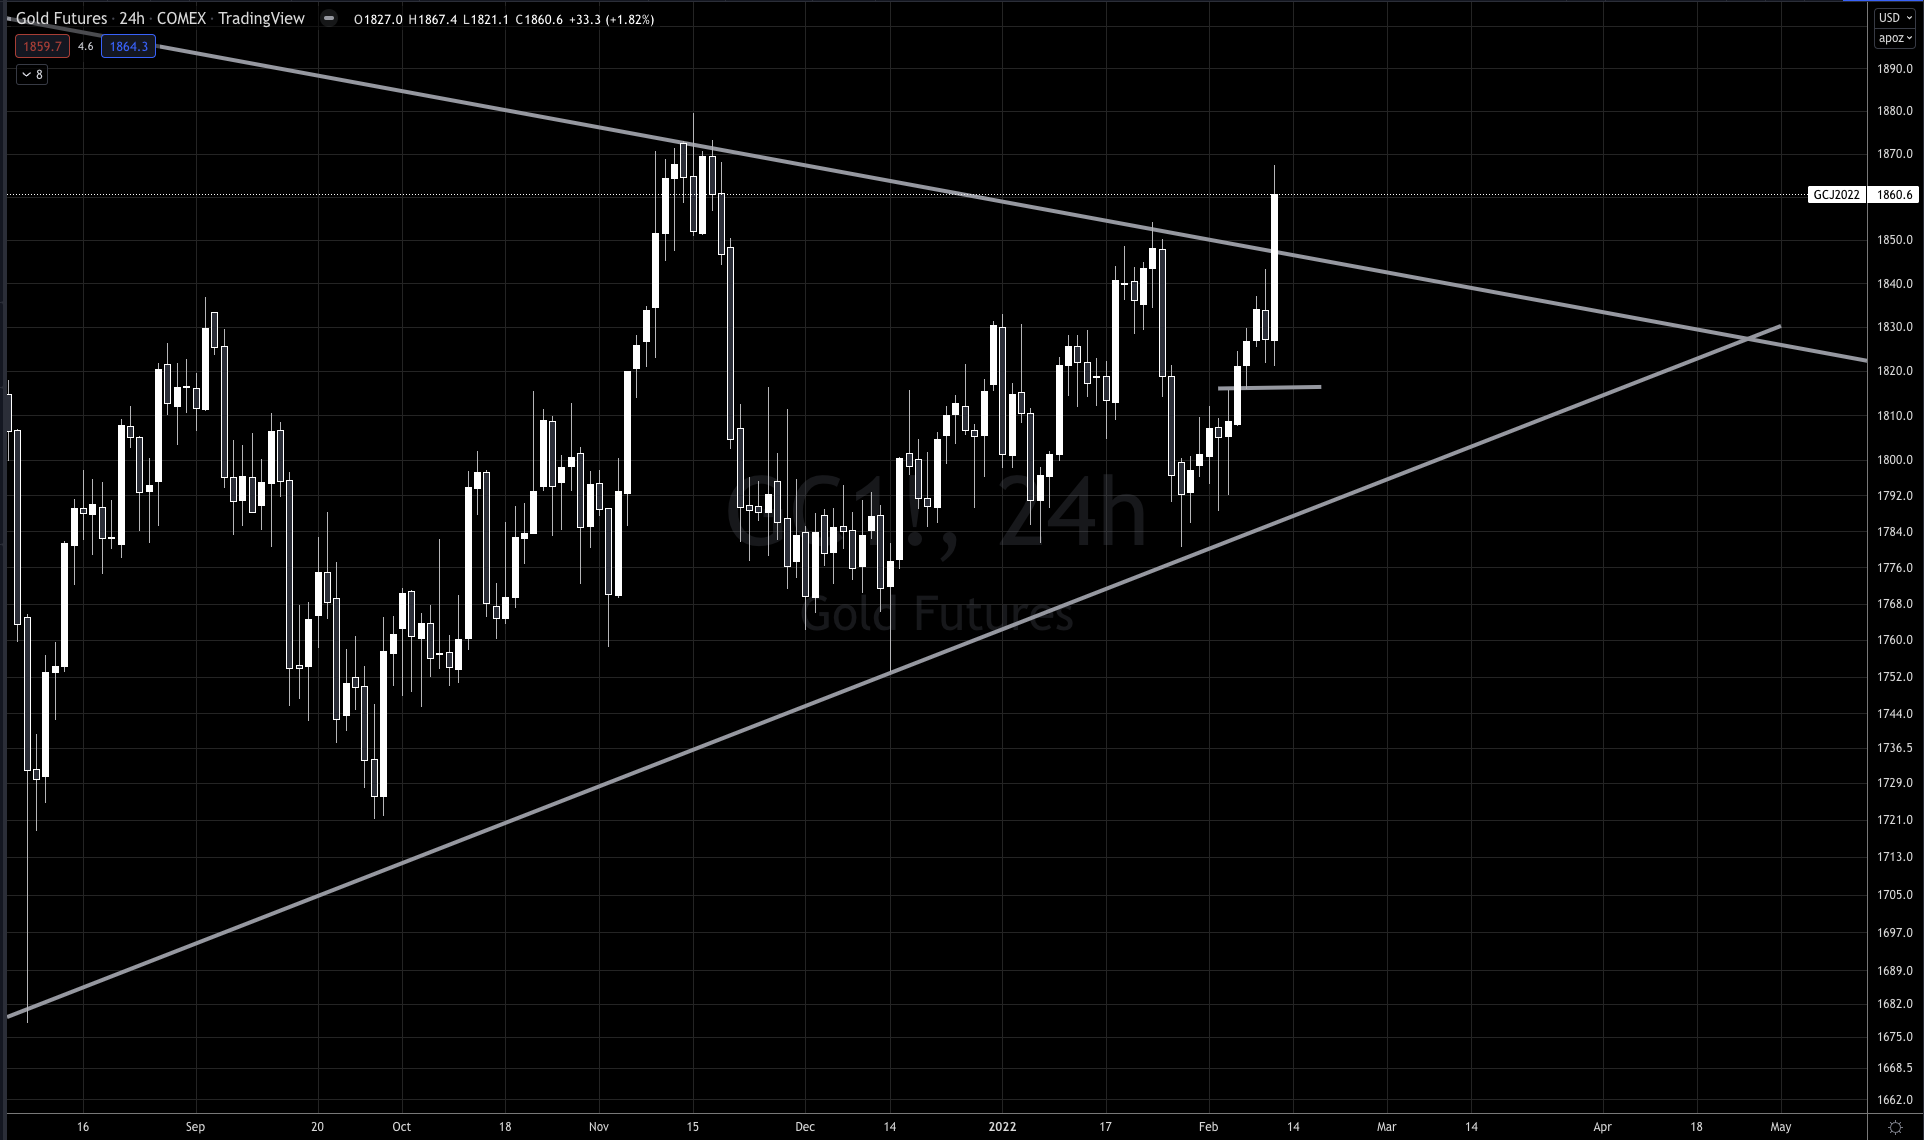
Don't get too excited yet, but Friday Gold appeared to break out of a 17 month down trend. Gold loves to break hearts, and wallets, but we have a number of factors supporting a potential run higher.
-Gold moved into a Bull Quiet market regime last week, which is characterized by a nice trend higher, where dips are bought and shorts get murdered.
-When $HYG is below 86 Gold tends to thrive.
-Gold signaled a Swing Beast long setup on Friday.
I am Long Gold and looking to add on pullbacks.
And Finally, I took a deep out of the money long on $NOC because it was one of those companies that didn't fall apart with the rest of the market. Of course the threat of World War III doesn't seem to be hurting a military/defense contractor, as you'd imagine.

If you want to learn more about the Swing Beast Momentum Strategy read about it here.
If you are ready to join an incredible community of traders join us in the Trading Lab
Stay connected with news and updates!
Join our mailing list to receive the latest news and updates from our team.
Don't worry, your information will not be shared.
We hate SPAM. We will never sell your information, for any reason.
