August 5, 2021 · Chris Dover
How To Find A Market Top
By far the most common question I’ve been asked lately is something to the effect of “Are we about to crash”, “Is this the market top”, referring to the Nasdaq $NQ/QQQ.
Rather than just giving a flat answer, I’m going to break down my risk management process.
The first thing I look at is the Market Regime, and the tool I use is the SQN indicator.
The SQN indicator is a tool to quantify the direction and daily change over the past 100 trading days.
Basically it figures out the difference between the previous day and todays close and makes a simple moving average of the last 100 days.
SQN = ((SMA * square root(period))/standard deviation)
Where the period is 100 days.
A simpler way to explain is the average change in price from today to yesterday of the last 100 days. This gives you a general read of the direction and if the day over day moves are big or small.
This is rendered as a histogram on the bottom of the chart.
Each color represents a different Market Regime.
Bull volatile = blue
Bull Quiet = green
Neutral = yellow
Bear Quiet = red
Bear volatile = crimson
By doing this I have a standardized way to differentiate the typical price action in a different environment, a frame of reference.
It isn’t meant to time moves, or to generate entries/exits but rather allow me to minimize the number of outcomes I can expect.
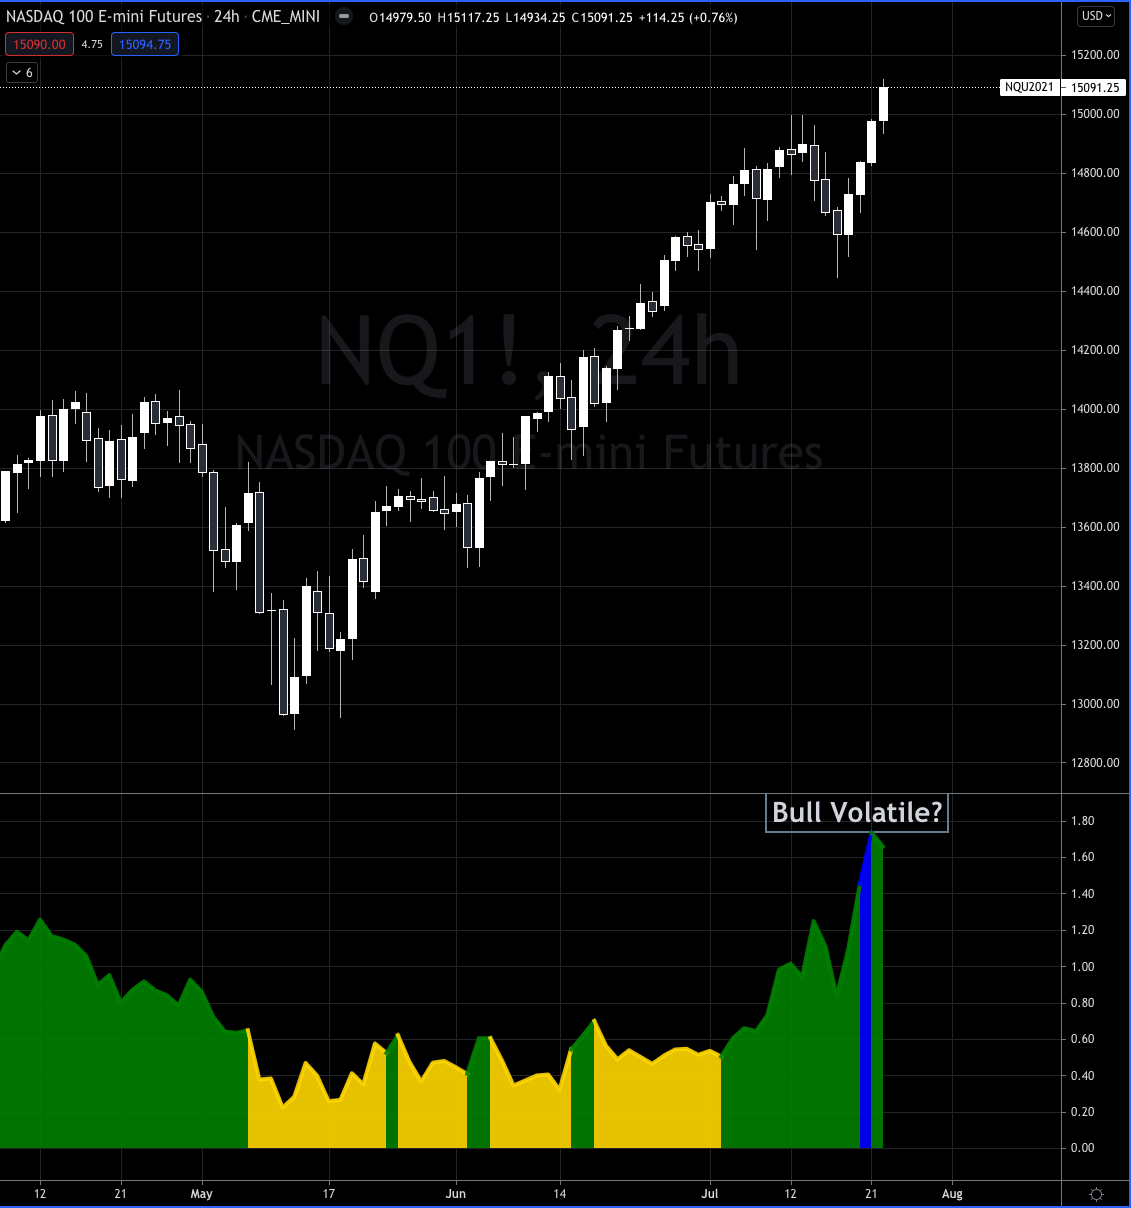
Currently in the NASDAQ $NQ we are right at the border of being in a Bull Quiet AND/OR Bull Volatile market regime.
Now here’s some nuance for ya, the $NQ futures trade about 22 Hours a day Sunday-Friday, so it allows traders and investors to essentially increase/decrease risk exposure pretty much any time they want.
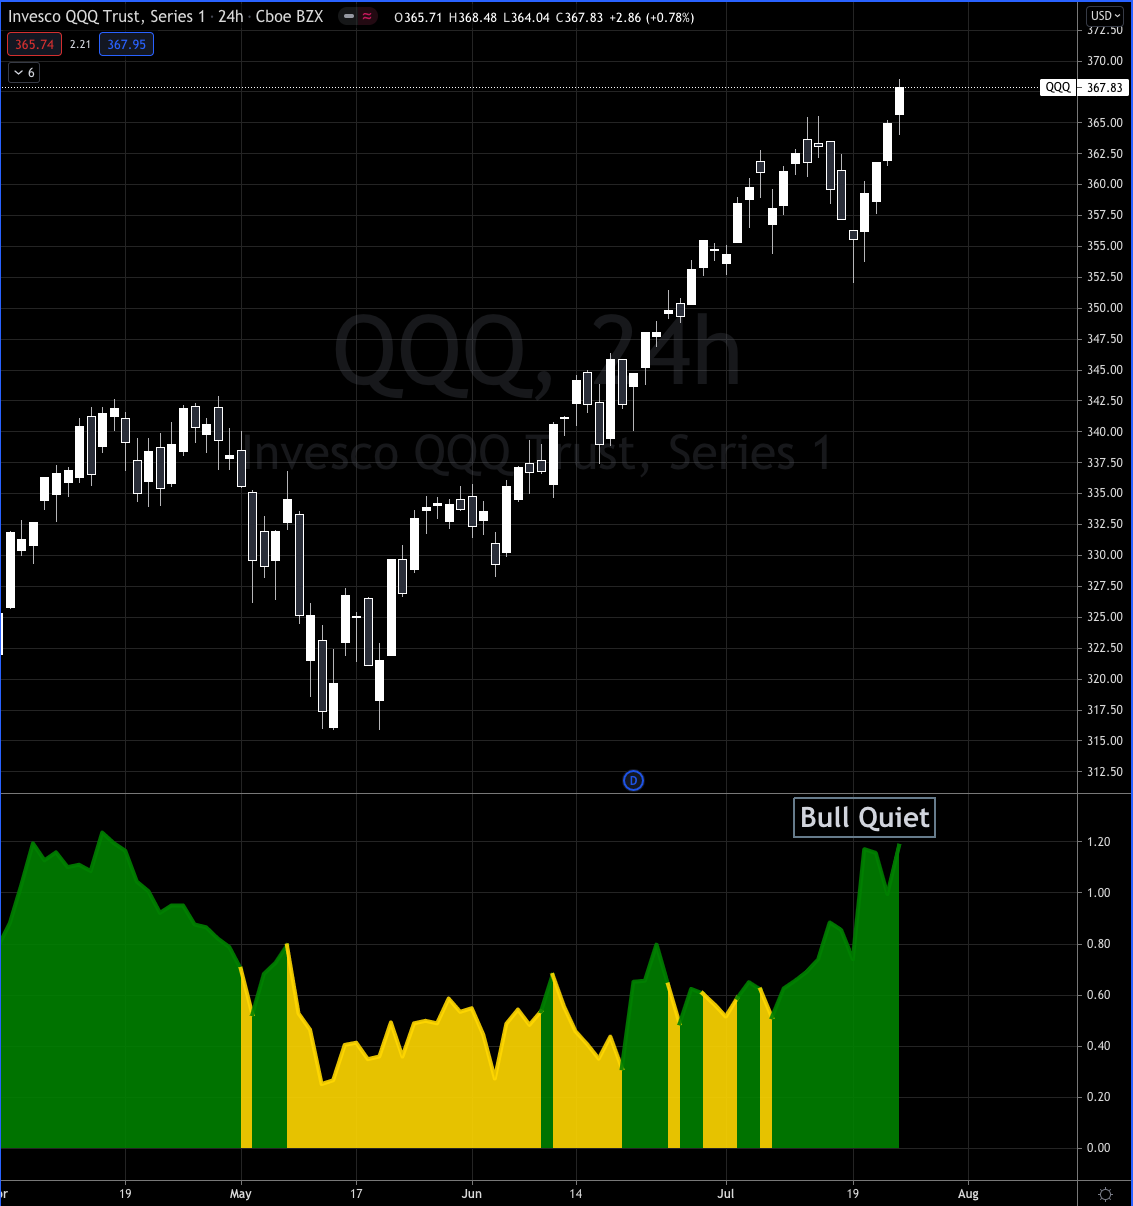
I bring that up because $QQQ (NASDAQ ETF) and $NDX (NASDAQ100 Index) only trade 12 hours and 6.5 hours respectively.
$QQQ
$NDX
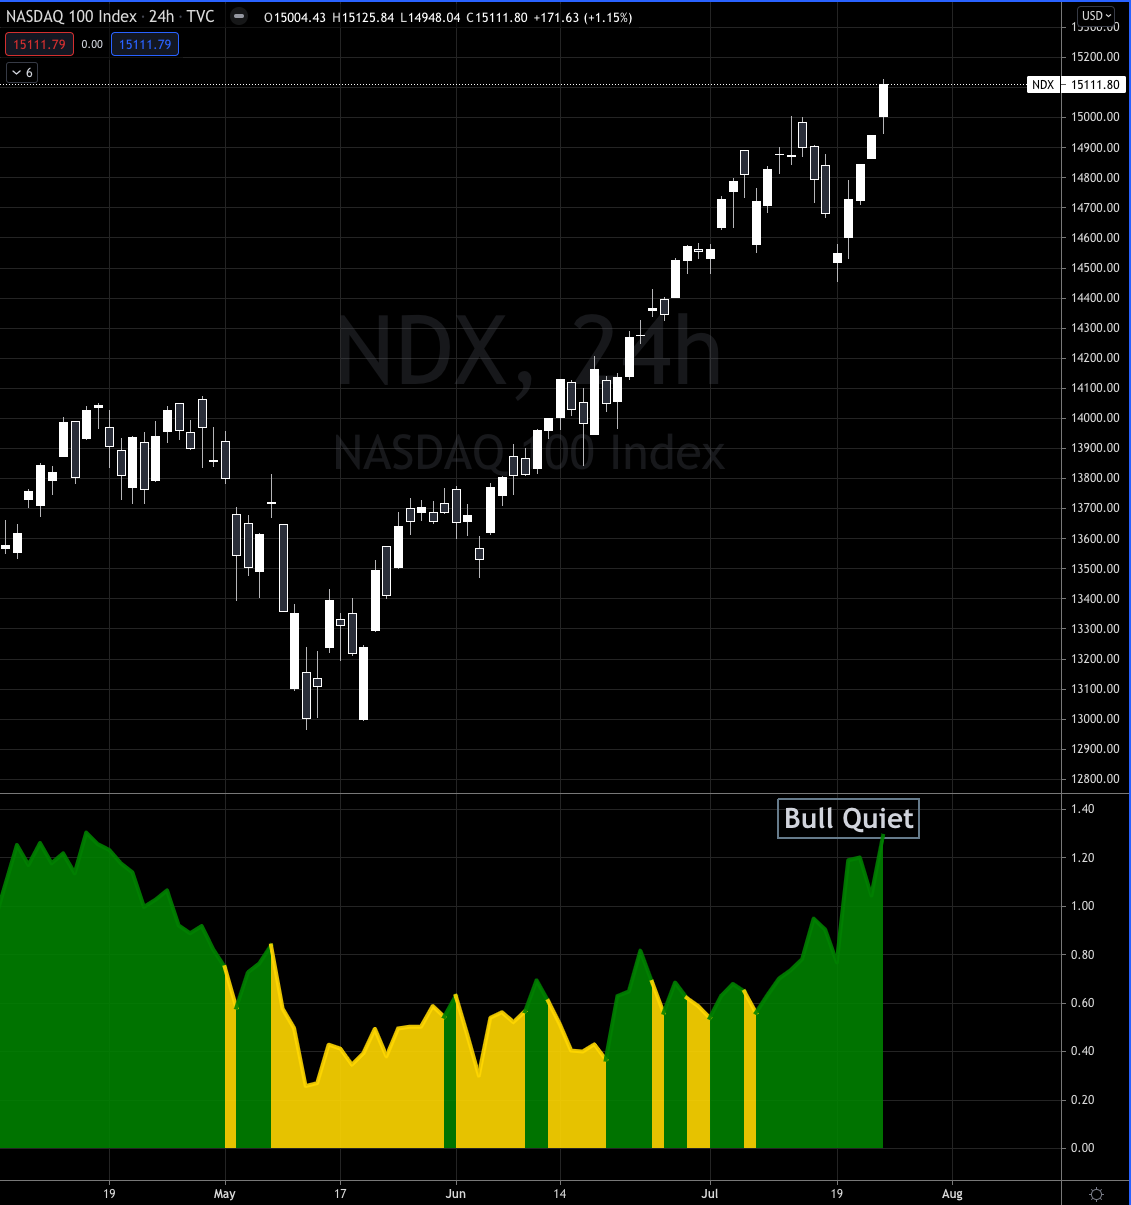
All three charts are basically the same instrument, but all three have different SQN readings, and without looking at all three you might be missing out on what’s really happening.
- $NQ 1.66
- $QQQ 1.20
- $NDX 1.30
A simple inference here would be that $NQ futures is putting in a bit more significant after hours moves and that could be interpreted that there is more buying appetite than can be fulfilled during regular hours, or that shorts are hedging with overnight long positions in the futures because the market is running away from them.
Also, who really knows? ¯\_(ツ)_/¯
Next I look at price action to get a better idea of if we are in Bull Quiet or Bull Volatile. Each market regime has its own “characteristic price action”, so once we’ve established a general neighborhood of bull quiet/volatile we can drill down deeper.
The way I read this, the $NQ has moved quickly off the May low’s, rallying over 2000 points and after Monday’s “bear scare” rallied 700 points in four mega bullish days.

When a candle opens at the bottom, and closes at the top with barely any wicks, that is a clear indication that the buyers are in control.
This means bears are trapped, and as bearish as it was at the end of the previous week and Monday, bears were pretty confident the world was about to burn.
And then it didn’t.
This confirms the price action that is very common in a Bull Quiet market regime.
In the Bull Quiet market regime I look for the best looking sell setups to fail, that is we get a bit of fear/pullback in the market that looks oh so juicy to the ravenous bear, only to turn on a dime and rip the bears face off…yet again.

And that’s exactly what happened.
In July we started buying the failed breakouts, getting long at 14,606.50, 14,822.25, and finally last Tuesday at 14,682.75 for an average price of 14,703.75 on the September contract.
We will continue to add to our position (In the trading lab) as long as we stay in the Bull Quiet regime (as per the SQN and price action), all the while buying as we get pullbacks that look like the best looking sell setup, that fail!
What about a market top?
This is where the importance of the Bull Volatile regime emerges. A key requirement for a major market top (8% or greater selloff), is that we are trading in a Bull Volatile regime.
That is a requirement of a major market top, but it doesn’t mean that the market will top, simply because it is in bull volatile.
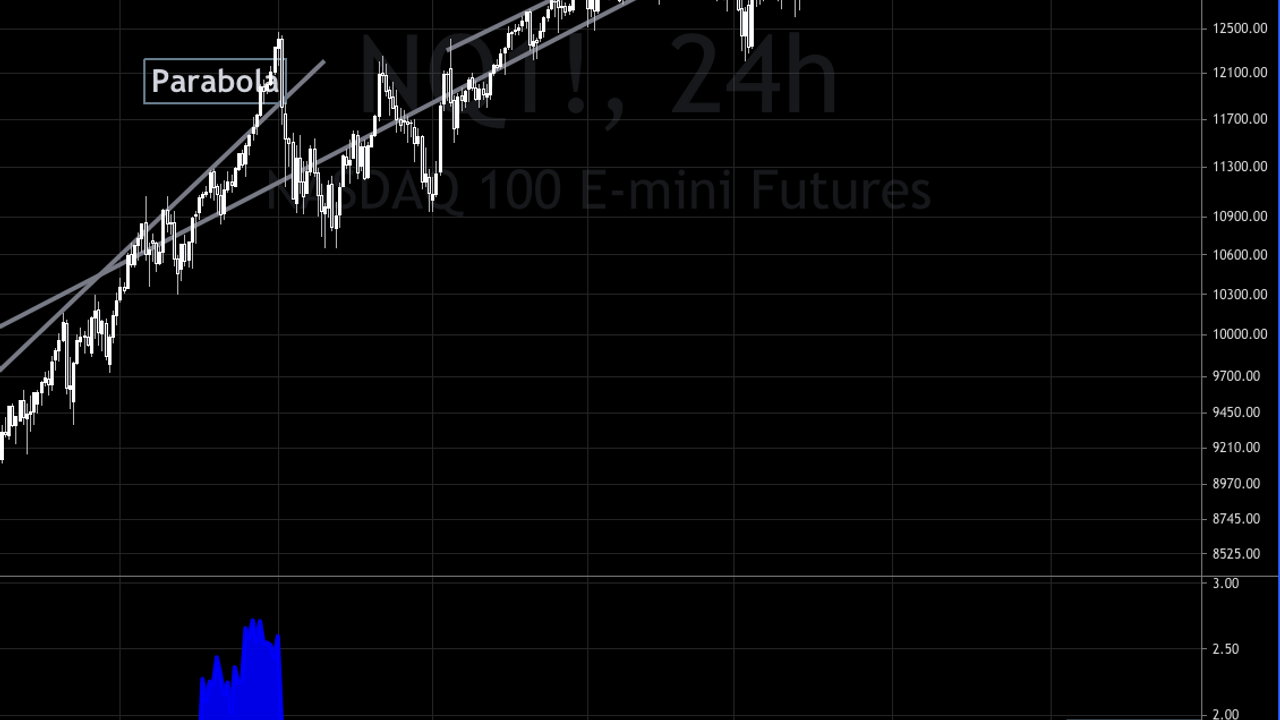
The next requirement I look for in a major market top is that price has gone parabolic, above its long term trend and short term trend. In this chart you can see where $NQ clearly got extra hot and took off in a frenzied manner.
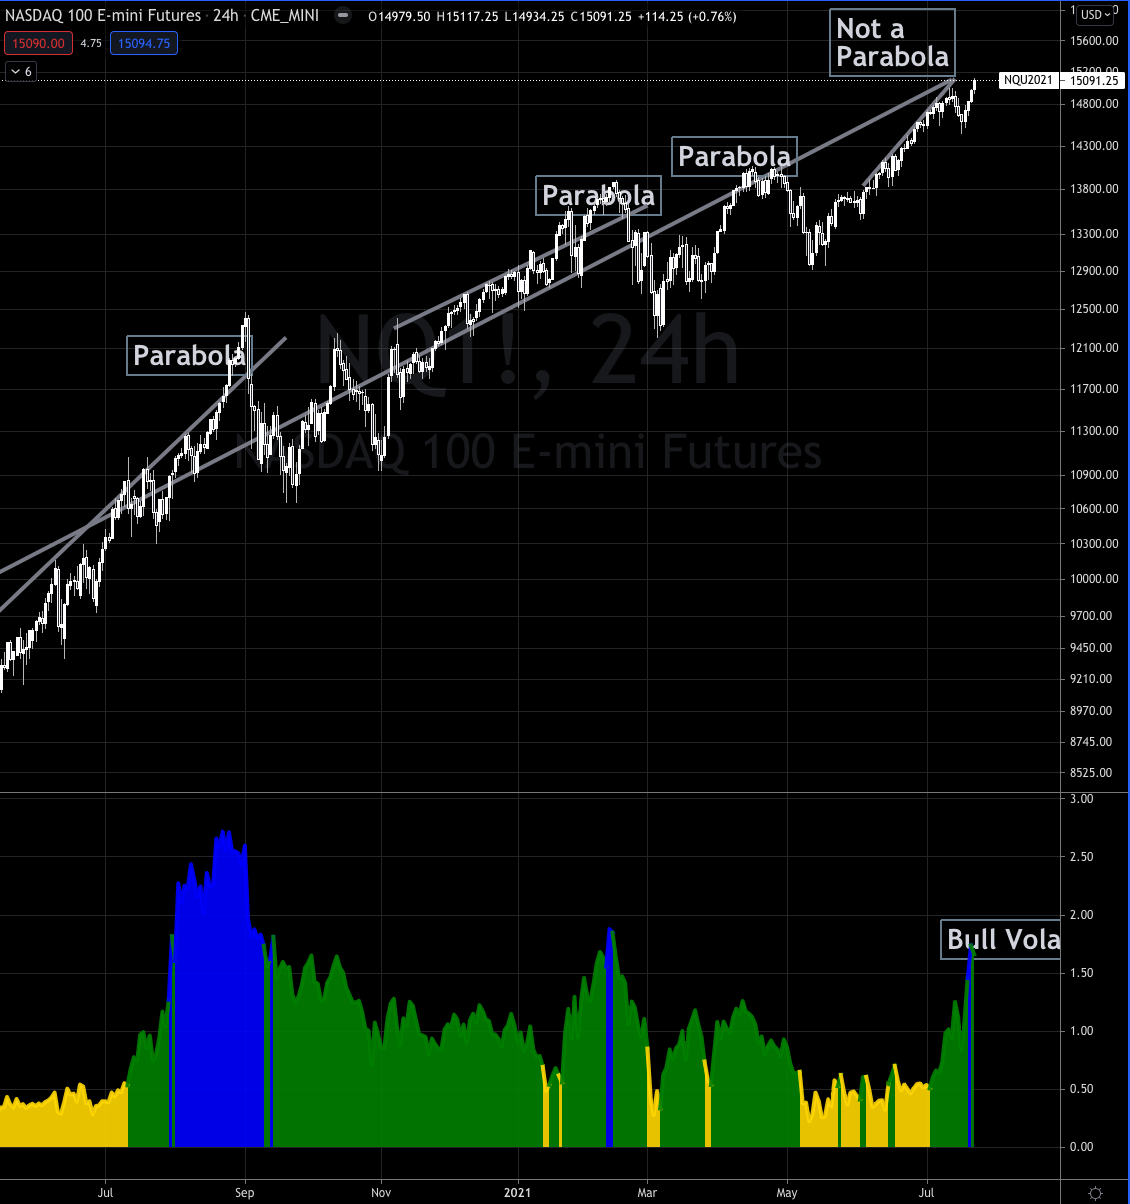
With this information we can clearly see that we are currently riding the trend normally, and until we break hard above that trend, things are as they should be.
Next I like to use measured moves to get an idea where price will likely end up…eventually.
Measuring from the April highs to May lows, gives us a price target of 16,908, nearly 2,000 points higher. 
And measuring from the July highs to Mondays low, that gives us a price target of around 15,500, which if hit before the end of the month wouldn’t give us a parabolic price spike and the SQN would likely be in Bull Volatile.
The final requirement I have to a major market top is that price closes above the monthly R3 Pivot (3rd Standard Deviation), which is at the 15,330 level.
LTDR; I don’t see a major market top happening this month unless we get above 15,500 on NQ (more like 16k) in back to back up days.
I fully expect to see 15,330 (likely 15,500 or higher) before the end of the month (this coming Friday) which is only about 400 points higher.
(I reserve the right to review my stance as new information arrives)
We played this exact scenario last summer on $NQ, you can see how it played out in this post on August 26, 2020… it kinda rhymes.
End of the Month Strategy
This month we are going live with our End of Month Strategy in the Trading Lab.
1 Year Performance
- Win Rate 91%
- Average Win 2.08R
- Average Loss 1.1R
- Average Hold Time 5 Days
The strategy has been a beast this past year, but it holds up over time as well.
21 Year Performance
- Win Rate 68%
- Average Win 1.9R
- Average Loss 1R
- Average Hold Time 5 Days
This is a swing trading strategy that is very easy to implement, it takes a couple minutes to set the buy order and a couple minutes a few days later to sell.
I’ve been considering offering trades like this and the Monthly ETF strategy at a discount price to the Trading Lab, especially for those of you who don’t have the time or interest to be more active during the trading days, as many of you have pointed out.
Reply to this email and let me know if you’d be interested in paying $100 per month for something like this.