
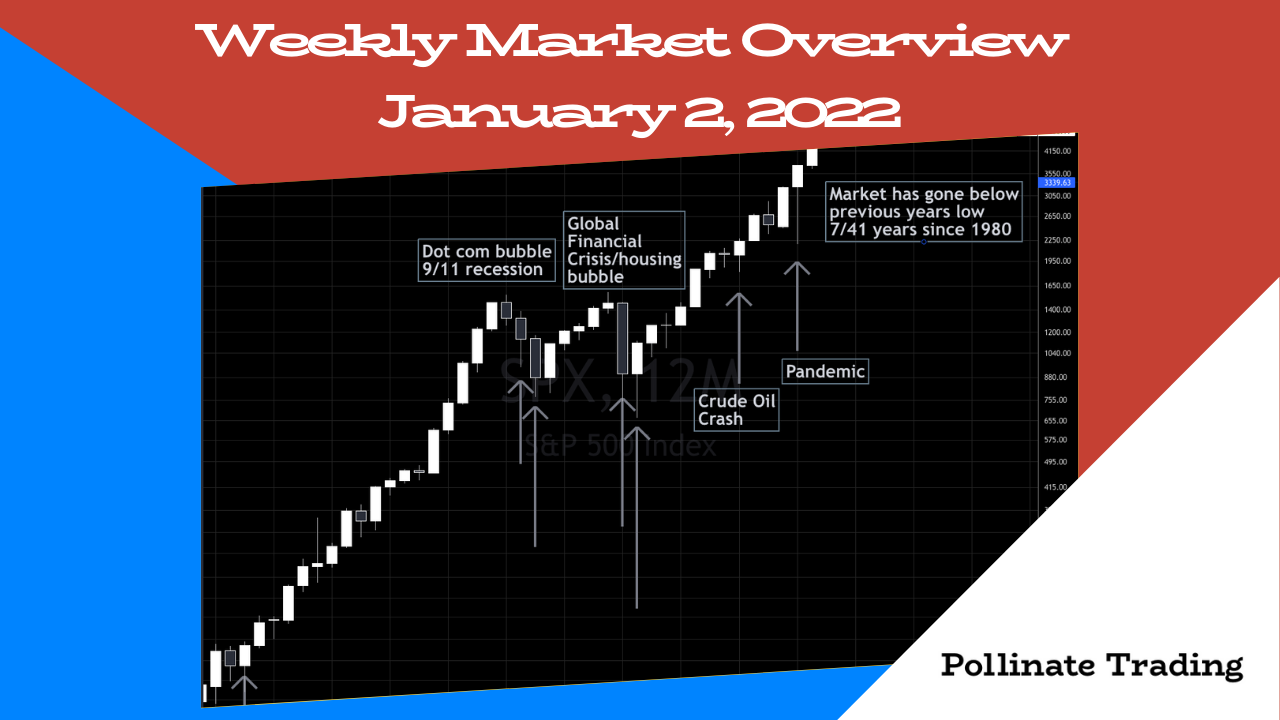
Weekly Market Overview January 2, 2022
Jan 01, 2022
There is nothing like a new beginning, and everyone has agreed that the beginning of a new calendar year is a new beginning so why not, let's get after it!
I spent a lot of time this holiday season with family and friends, nearly every one of them was asking me when we will get a big correction in housing prices and the stock market.
Obviously these were people who index invest or own big tech names, and not any of the recent IPO's, Non Profitable Tech or Stay at Home stocks because those stocks are in a painful bear market. It's painful because literally everything else is up on the year, ouch!
(h/t to one of our lab members for sharing the Goldman Macro Baskets, who would prefer to remain anonymous)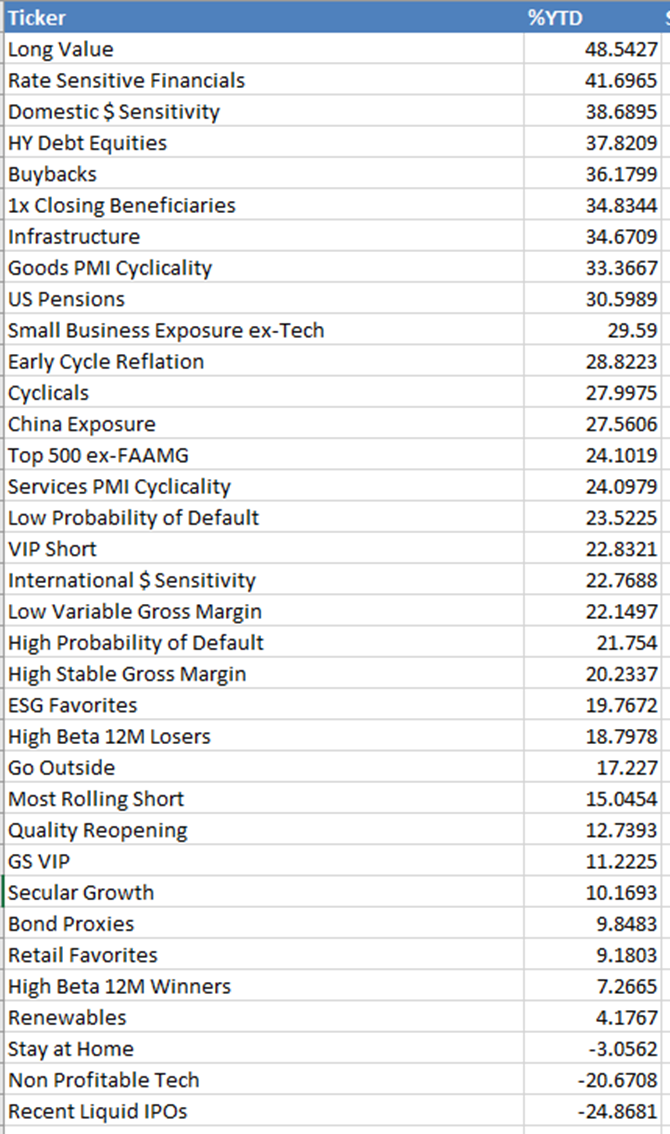
Everyone is taking profits, selling second homes because they are all scared that there is a market top right around the corner and they don't want to be left holding the bag when the market drops.
My answer to everyone one of them is:
"What are you going to do with the money if you sell?"
If you put it in a savings account, you'll be crushed by inflation, which should be obvious to nearly everyone by now. I've been writing about this since the Covid bottom, here's a good one from back in March 2021. (They should subscribe to the newsletter, come on friend and fam!)
The house I'm in was up nearly 40% in value in one year, and I'm not the lucky one, find me a home that's value hasn't shot up since the beginning of 2020.
If you put your money in to a savings account and didn't buy a home, for example, you'd have 40% less buying power.
$100,000 worth on Dec 31, 2019 (two years ago) buys you $60,000 worth of home today.
If you put your money in to a savings account and didn't buy $SPY, for example, you'd have 27% less buying power.
So $100,000 Dec 31, 2020 buys you $73,000 worth of stocks today.
One or two people that don't do this for a living asking me about when the market is about to top wouldn't be all that interesting, but nearly all of them are asking, that's a qualitative sign to me that we are a long way away from a lost decade.
S&P 500 ($SPX)
2021 was a really strong year for the S&P 500 (SPX) returning nearly 27% and is a mere 4.68% away from that big round $5000 number.
The previous years range is important to keep in mind, as bad things can happen when we go below the previous years low, that's actually how I characterize a true bear market (not to be confused with bearish regime).
Price dropping below the previous years low means everyone who bought that year is now underwater, and that sort of action causes major selling to step in.
In the past 40+ years, since 1980, the $SPX has gone below the previous years low only 7 times.
1982 - Paul Volker spikes rates
2001 - Dot Com Bubble
2002 - 9/11 Recession
2008 - Housing Bubble
2009 - Global Financial Crisis
2016 - Crude Oil crashes
2020 - CoVid Crisis
More interesting is that usually, save for the 2000's, the market bottoms after and we return higher that year. 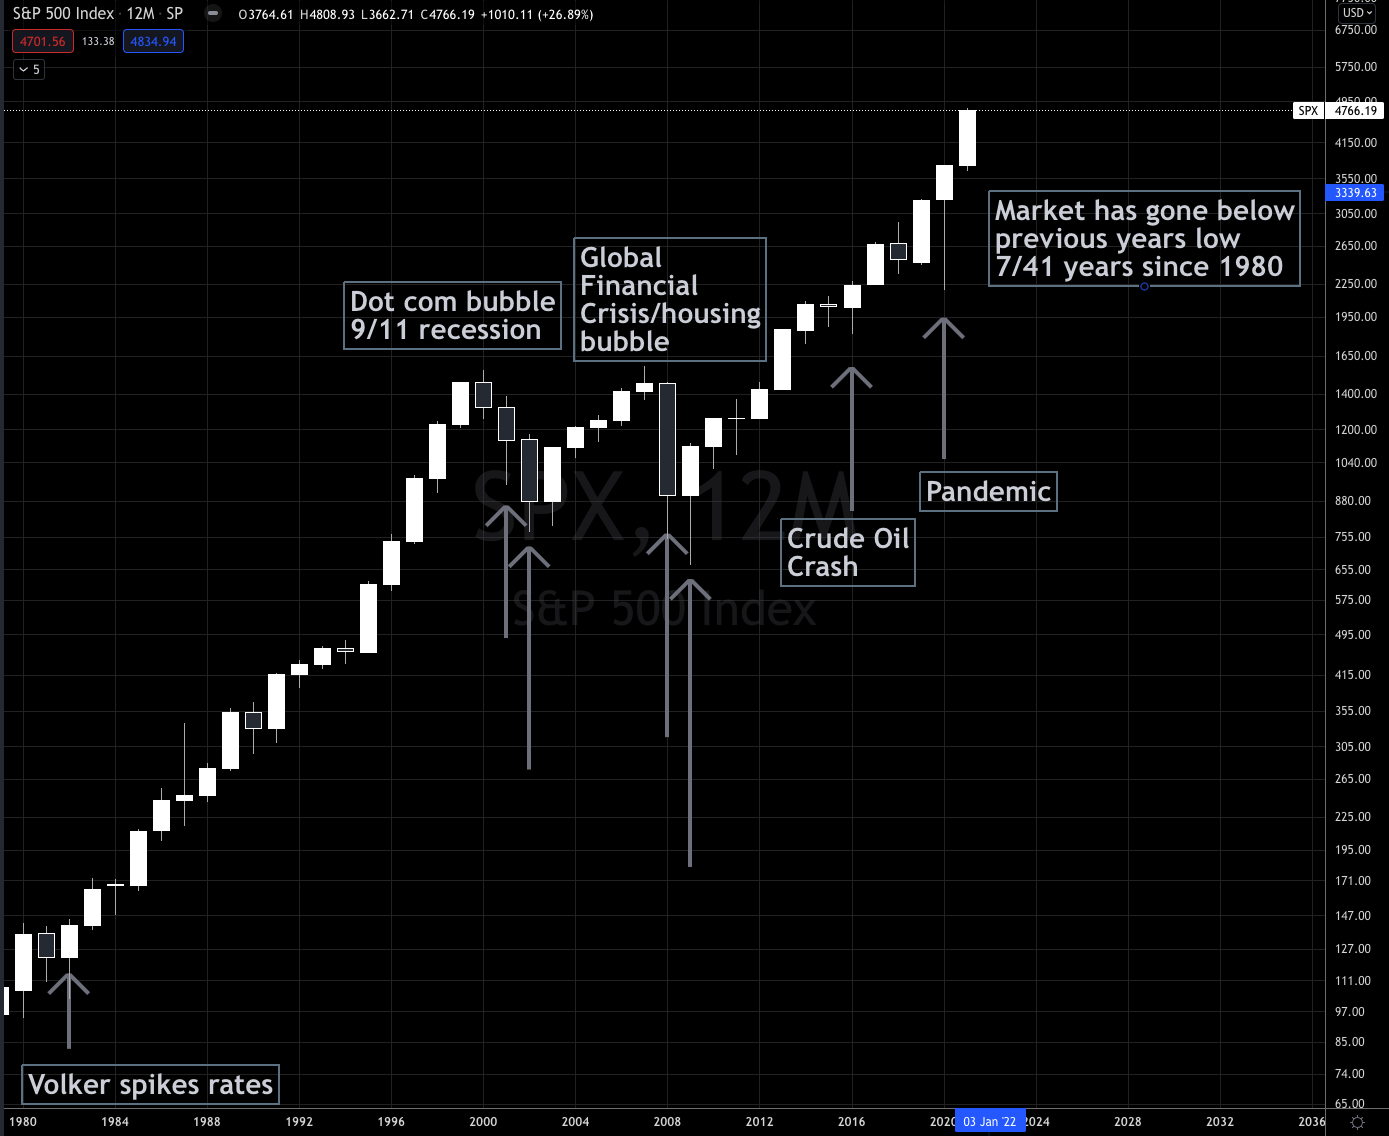
Looking a little deeper at the $SPX historically, the last time we were in a ~10 year(ish) go no where market, the 1970's, the $SPX was up well over 1300% before getting another year where prices went below the previous year from 1980-2000, a 20 year bull run.
That 20 year period included Black Monday in 1987, Gulf War I, Asian Contagion, Long Term Capital Management, Tequila Crisis and a bunch of other events that definitely rocked the markets but bull markets need these crisis as rocket fuel.
Despite how the chart looks, bull markets are very hard, very frustrating always scaring people out of the market, only to return later paying higher prices...that's how bull markets work.
Comparing 1980-2000 to where we are currently in $SPX, 8 years in to this impressive bull run, we are only up 234% since breaking above the market highs of 2000, in 2013 (13 years of nothing!).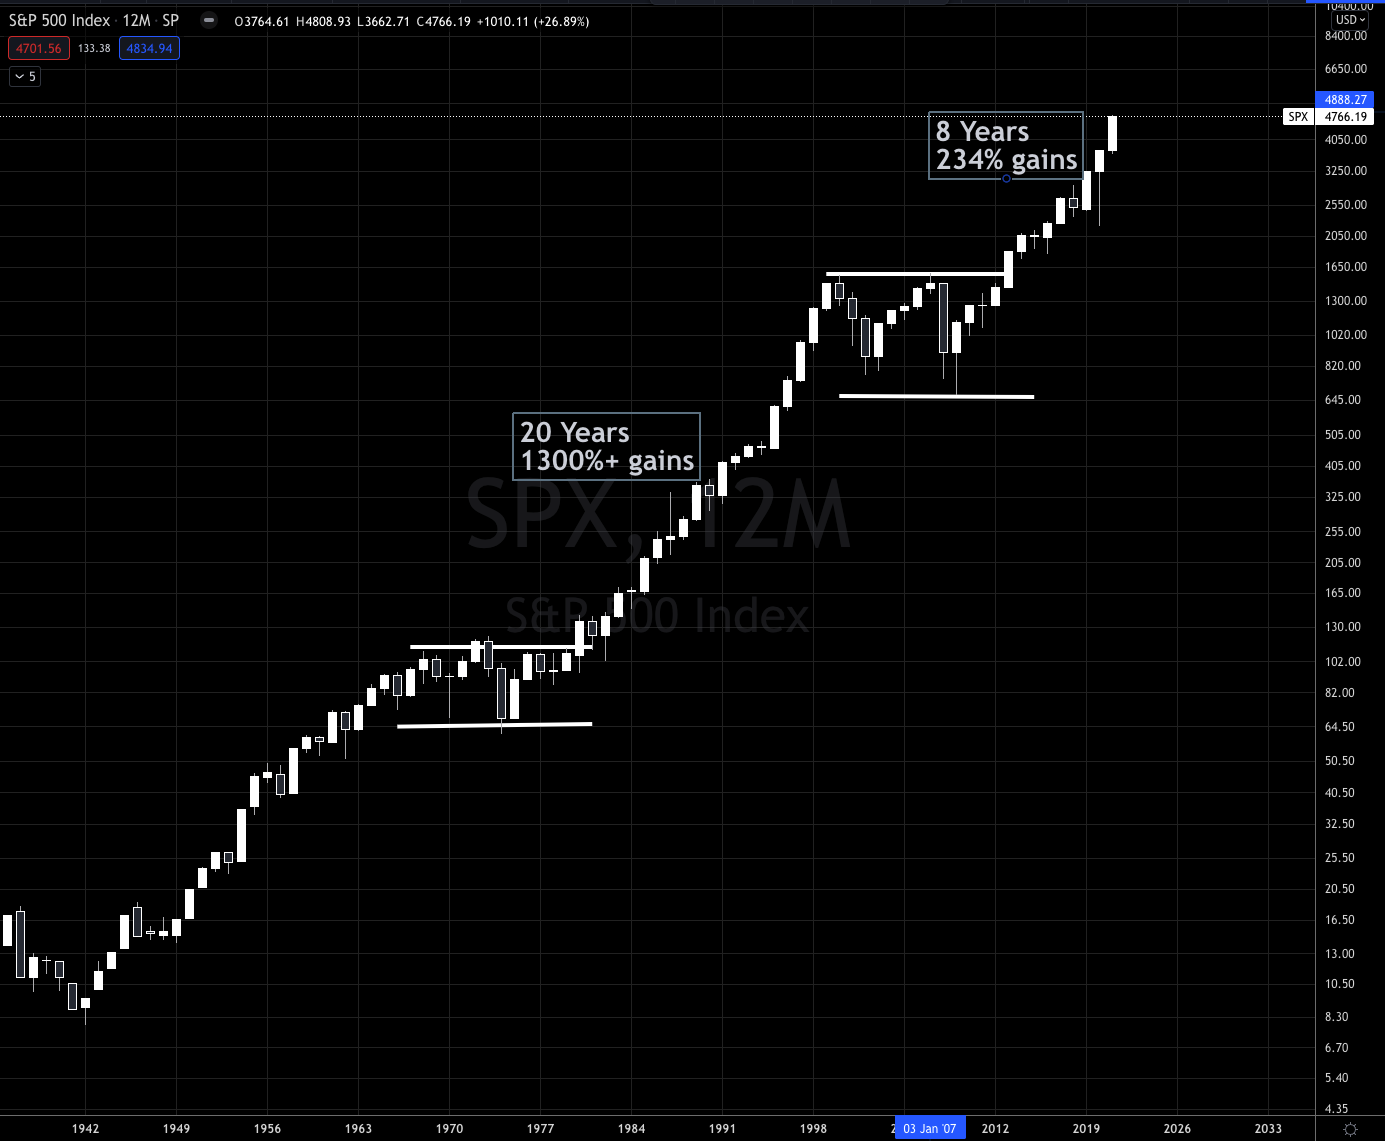
It took 13 years before the S&P 500 made new highs after the Dot Com Bubble, that means there were people who sat on losses for 13 years before ever seeing new highs, assuming they held things that didn't go bankrupt.
There is all sorts of market rhetoric that this market is unprecedented, that markets have never behaved this way, but that's just not true.
I'd say we are closer to the mid part of the 1990's than we are to the end of it.
Swing Beast Setups
We have some incredible Swing Beast setups on $NQ, $FB, $TSLA, $TGT to name a few (there's a lot really).
If you bought the strategy or are a lab member, you know what to do here!!!
The strategy moves in cycles and we are right at the beginning of the next cycle.
You can join us in the Trading Lab where we will be getting positioned for some potentially big moves this month as move move in to one of the most bullish seasons of the year.
(h/t Topdowncharts.com)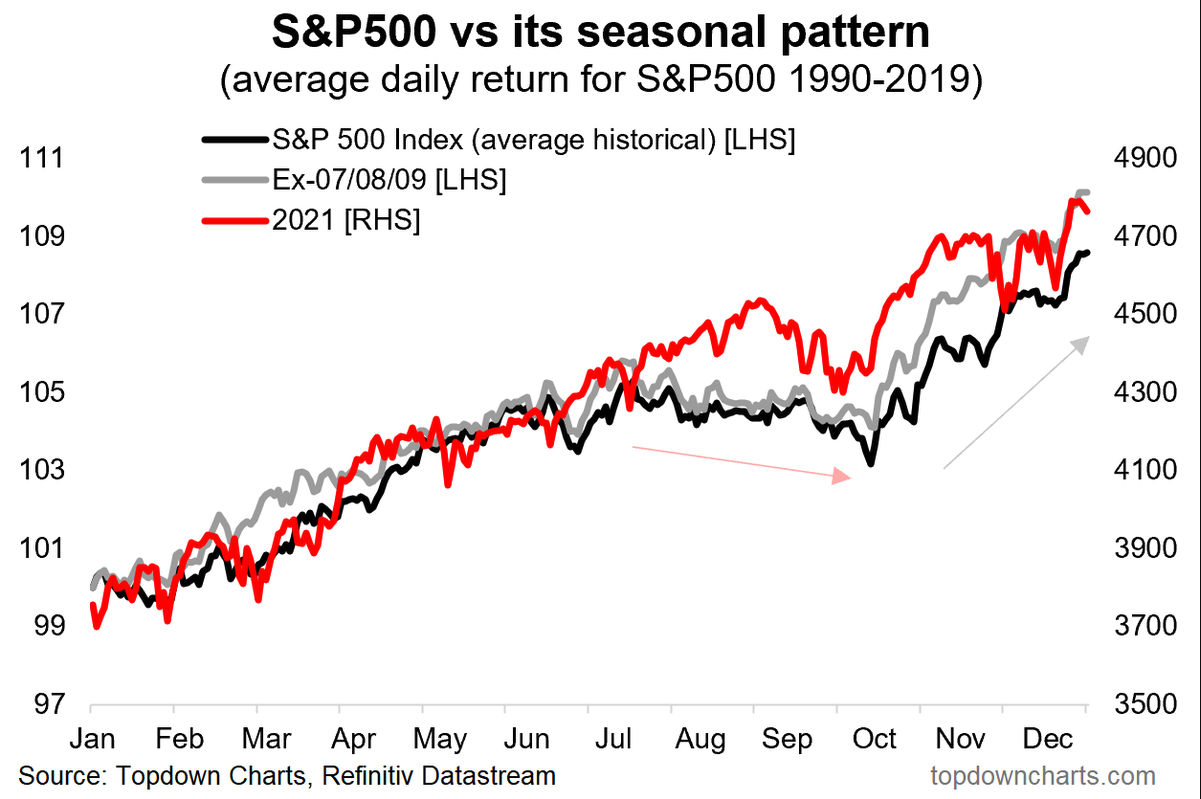
Or if you'd rather just get the strategy and not fuss with us you can get access to the Swing Beast strategy here.
Here's a screenshot of my $AAPL swing beast trade from Nov/Dec 2021 as a recent example that I've been talking about since I got in back in November.
Keep an eye on $TSLA, they just destroyed their Q4 sales numbers, exceeding expectations...not anything I use to base trades on BTW, but that'll likely equal a big gap up on Monday.
More importantly $TSLA went long last week for a Swing Beast trade!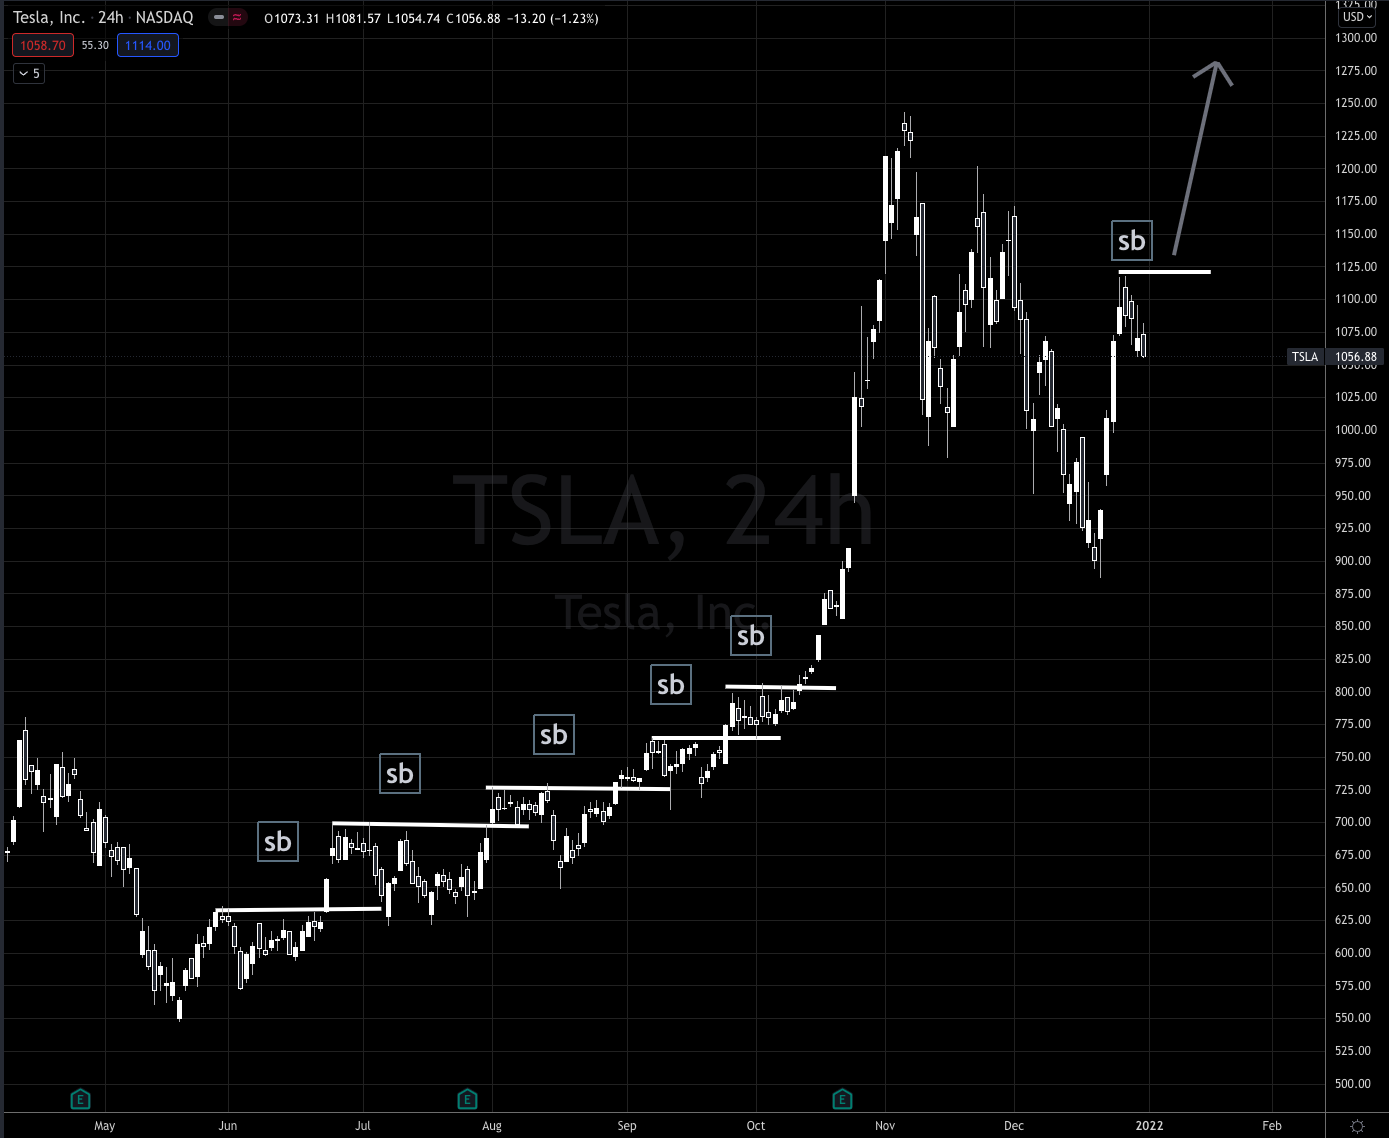
Happy Trading and Happy New Year!
Stay connected with news and updates!
Join our mailing list to receive the latest news and updates from our team.
Don't worry, your information will not be shared.
We hate SPAM. We will never sell your information, for any reason.
