
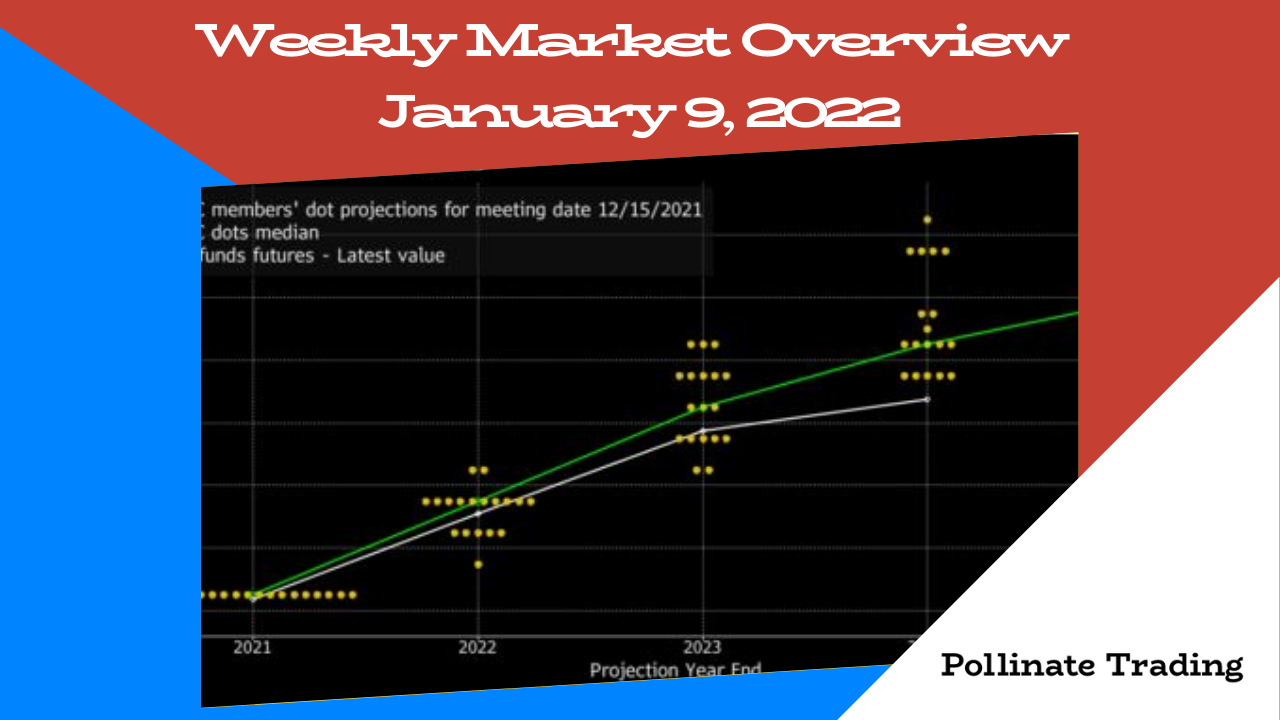
Weekly Market Overview January 9, 2022
Jan 08, 2022Sometimes markets move higher, day over day, week over week, without the slightest hint of stress. Everyone is making money, bad news is good news, good news is great news, and you wander right through a pandemic with a different set of worries than you ever thought you'd be worrying about during a pandemic.
If I asked you four years ago what the world would look like during a pandemic, first off, you'd laugh off the idea of a pandemic, but eventually I convince you to play this game with me.
That version of a pandemic would show everyone walking around, if they were even allowed out of their homes, wearing full PPE suits, from booties, to self contained oxygen rebreathers and a complete shell layer not allowing .01% of their body to be exposed to the environment.
Four years ago you would have expected to see military everywhere, quick reaction teams tracking superspreaders down like the FBI days after 9/11.
Now on the doorstep of our third year in a pandemic we have US Equity markets at all time highs, Door Dash drivers leaving your Bitcoin Pizza (yes that's a real thing) and Amazon deliveries throughout the day bringing another new piece of workout equipment, an extra monitor, the latest iPhone and more socks!
This version of a pandemic that we are currently living through has been unlike anything we expected a pandemic to be like, because governments keep sending us free money and if we want more, it basically costs pennies to get more from any mountain of lenders dying to get a basis point of yield.
Restaurants are open, the internet is fast and Tik Tok is hilarious.
Everything is a million times better than what would have ever thought a pandemic would've looked like, four years ago.
Until interest rates start rising, which this past week the US Federal Reserve made it clear, after releasing the minutes to the last Fed Meeting, that they would be reducing their $8.8 Trillion bond holdings in a couple of months. Which means they'd be selling the bonds that they bought to save the world during the first part of the pandemic. That would flood the bond markets with assets (inventory) thus lowering the price on the bonds and increasing the interest rates offered on those bonds to entice bond buyers aka tapering.
Fed members also said they foresee up to three quarter-percentage point increases in 2022, as well as another three hikes in 2023 and two more the year after that.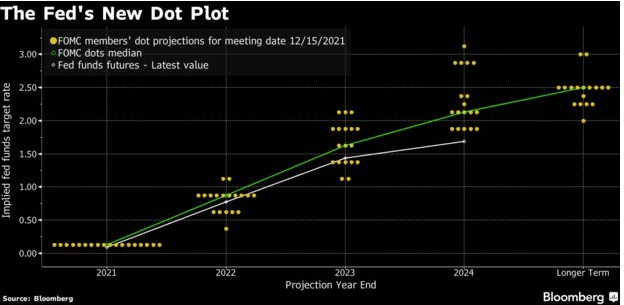
Everyone expects the first rate hike to happen in March of 2022 and the minutes suggest aggressive and quick "normalization" with 2018 in the back of their mind (more on that later).
Everyone will be watching the unemployment numbers and inflation.
With unemployment down to 4.2% in November, which is quite close to the pre-pandemic levels of 3.5%, adding 425,000 new people to payrolls, there's a lot of people with income to spend on things...inflation.
Inflation measured by Consumer Price Index (CPI) rose 6.8% in the last 12 months, the fastest pace since the 1980's (more on that later).
if anything changes in labor and CPI we may see the rate of change of interest rates increase or decrease, and I'd expect any labor or inflation numbers released to be very volatile for most liquid asset classes.
More On That Later (Econ (light) Version)
Since 1980 US interest rates have been dropping steadily, from a high in 1980 of 18.90% for the US Fed Funds Rate to a pandemic low of 0.05%.
In the past 22+ years, since Alan Greenspan's era, we can see three very distinct times where the US Government has made efforts to cool the economy off by raising rates. 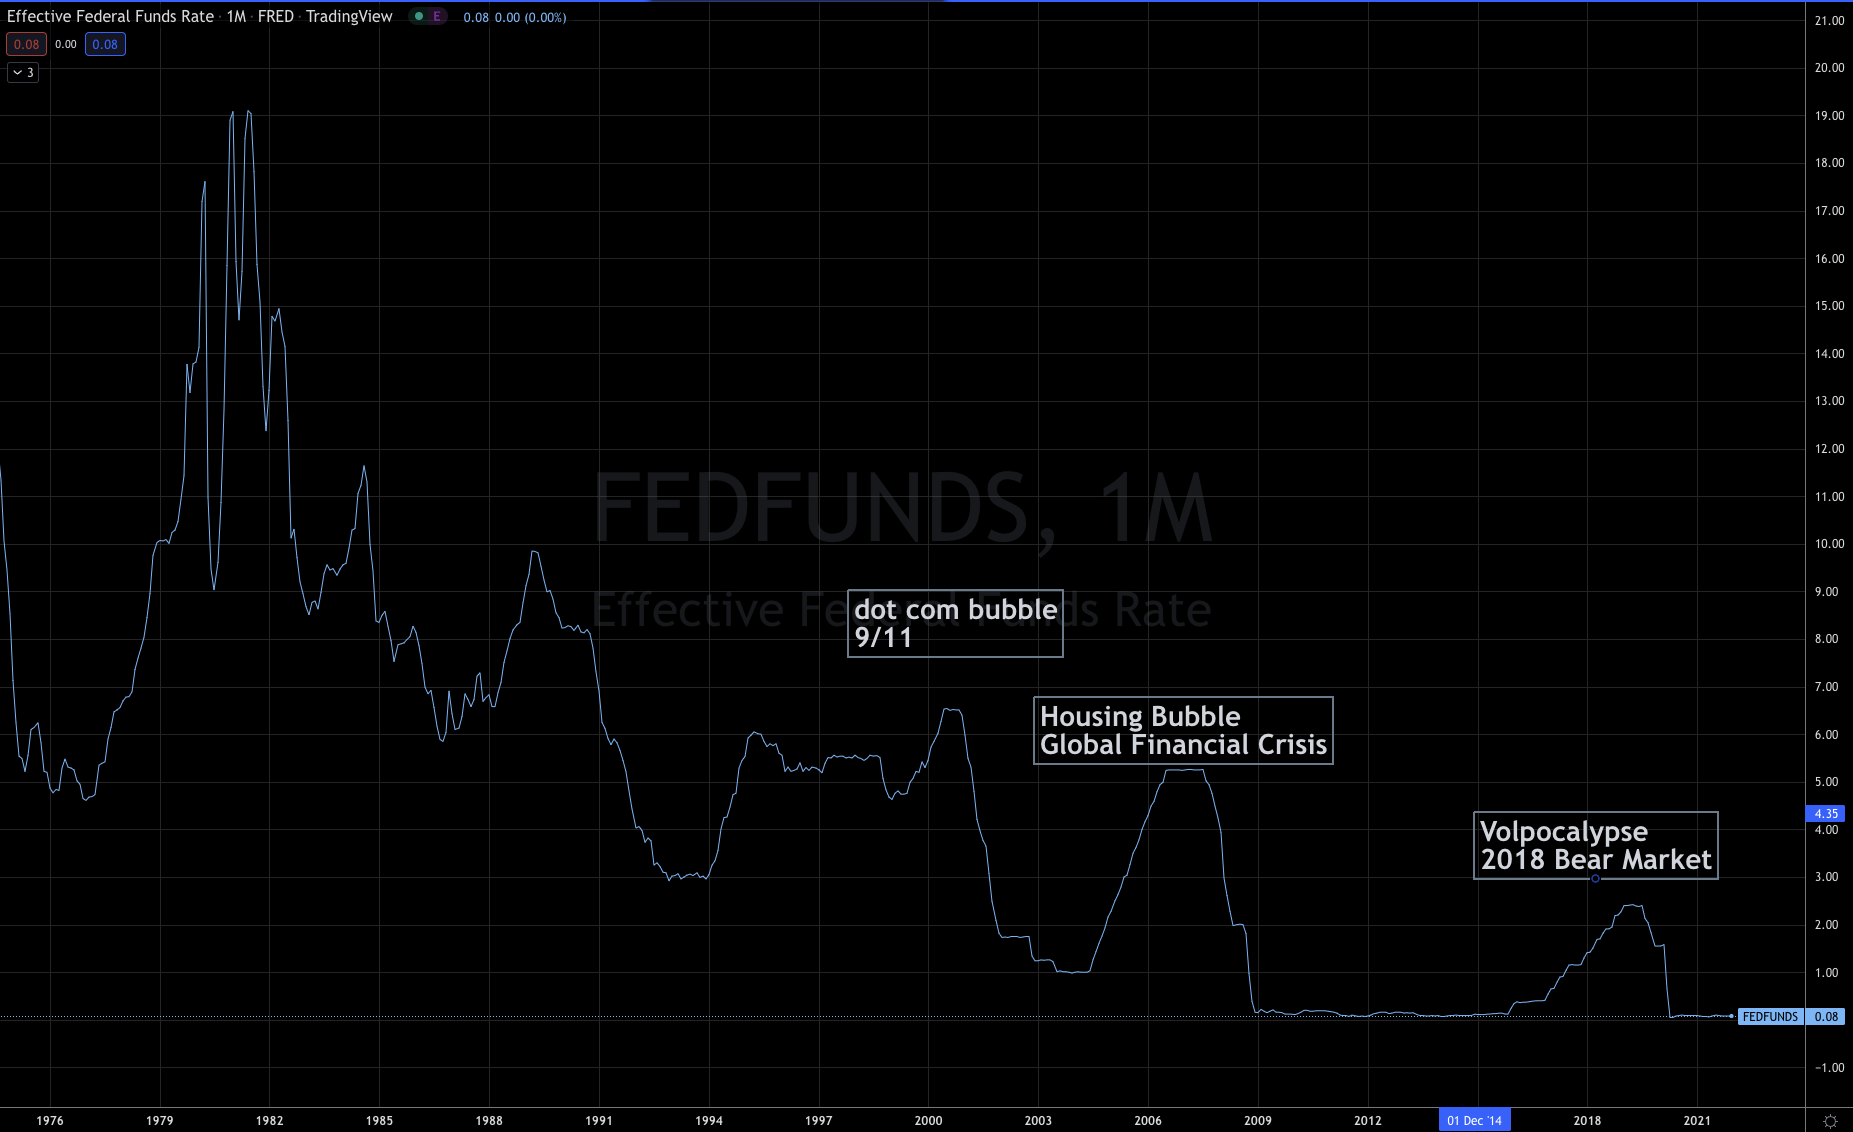
Prior to the Dot Com Bubble in 2000 the fed raised rates by over 2% before the equity markets began to crash, notably tech, and they had to step in aggressively to cut rates and then 9/11 happened and they dropped rates from a high of 6.53% in the summer of 2000 to December 2003 low of 0.98% the lowest ever, at that time.
Then coming out of that recession the housing market skyrocketed, along with Fed Funds Rates rising over 4%, until 2007 when Bear Sterns then Lehman Brothers bankruptcy's crushed financial markets causing unprecedented, again, rate drops, to a low of 0.15% before the equity markets began to recover.
However "that time was different", and the Government started buying up treasuries while keeping the Fed Funds rates under .20%.
It took 7 years, until 2016 before they were again able to raise interest rates, this time going as far as 2.40% before 2018 started to show cracks in the system, again.
2018 is relevant because the US Equity Markets and the US 10 year Yield are, so far, acting exactly the same.
More On That Later (Trader Version)
Volpocalypse, if you haven't heard of that, you can read more about it here.
On February 5th 2018 the $VIX (Volatility Index) had its largest single day gain ever, rising 115% in ONE FREAKING DAY!
The $SPX (S&P 500 Index) lost over 11% during that week, and it took until August of 2018 for the SPX to make it back to pre-volpocalypse highs.
Ok sure, a volatility fund blowing up in a single day because they were excessively short the $VIX and got ran on might rattle markets a bit, but that was only a symptom.
What really was stirring markets was the interest rates rising.
When rates rise (or drop) that causes major changes to risk models, of the big institutions, the bigger, the more it changes those models.
The larger the institution, the more a quarter point interest rate has on them.
25 Basis points on $100,000 is barely noticeable.
25 basis points on $1,000,000,000 is millions of dollars.
25 basis points on $1 Trillion is billions of dollars
These large institutions are not just leaving that money in a savings account, they have them in government treasuries, in currency or commodity hedges, in venture investments, in real estate, and like many of them, buying back their own stocks or companies like Berskshire Hathaway that also buying stock of other companies.
When one of the most risk free assets in the world, the US Treasury Bonds and Notes are kicking off higher interest rates it becomes a logical place to consider moving riskier assets into.
And this becomes a bit of a feedback loop, rates rise, risk assets drop.
It isn't a one for one, where the 10 Year rises .50% and the $NDX (Nasdaq 100) drop .50%, it's more of a prolonged path of rates rising or the rate of change (how fast) rates rise that causes this to happen.
Take for example 2017 to 2018 the US 10 Year Yield was basically moving around between 2.60% and 2.00%, starting and ending the year at nearly the same levels, while the $NDX was up over 31% on the year.
Stable rates are a dream scenario for high leverage and high volatility assets like tech because if you have a stable range then you have stable inputs to your risk models, when they change, risk models change.
That well established trend in the Fed Funds rate since the early 1980's has been even more well respected only breeching the top trend line once before 2018, and that one time was right at the beginning of the Housing Bubble/Global Financial Crisis in 2007.
Previous touches (not breeches) of this trend line coincided with Dot Com Bubble in 2000, the Bond Market Crisis in 1994, the early 1990's recession in the "west" and Black Monday in 1987.
Suffice it to say, that trend line was delicate, and accurate.
When that trend line was breeched in January of 2018 there was a lot of confusion and fear, this was the first time that trend line was really breeched.
As I mentioned, in January and February the $SPX lost 11% in about a week, the $VIX shot up 115% in a single day, a vol fund was liquidated and the markets were shook.
Despite this doomsday looking trend line the world continued along, with the $SPX printing new all time highs in August and September of that year, all the while the Federal Reserve had been raising rates.
Then in October the 10 Year Yield moved firmly above the 3% level and markets got shook, the $SPX sold off 10% in October, making November (Mid Term Elections, ahem) a bit volatile before breaking down another 10% with day after day selling until the final blowoff bottom on Christmas day.
The $SPX took it hard, but that index isn't made up of as many high leverage growth companies like the $NDX is which went down nearly 30% before reversing.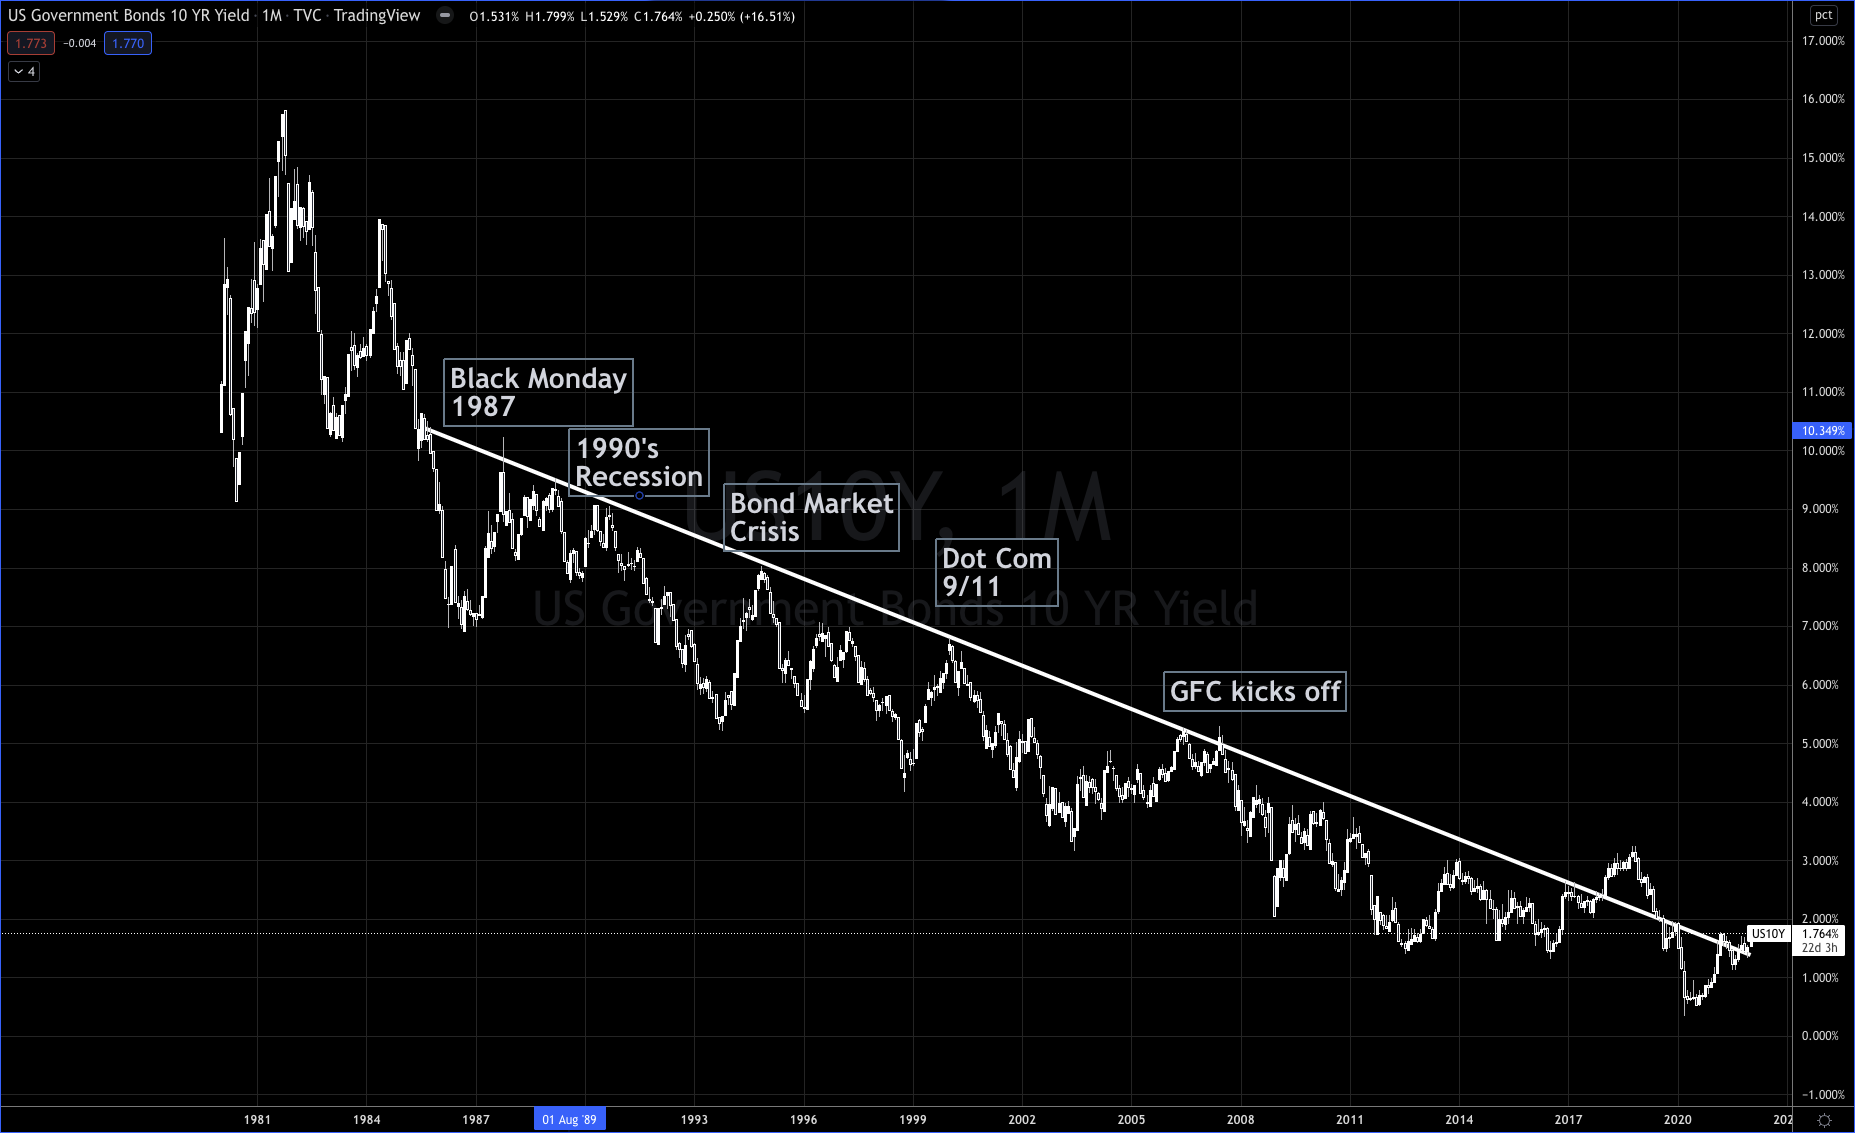
And again, the US Government had to do everything they could to restore the markets and they did drop rates hoping to hold rates around 2% to 2.5%...before the CoVid crisis again threw a monkey wrench in the plan.
Which brings us to today, a very similar setup as 2018, stock markets off record highs, US 10 Year Yields breeching that 40 year trend line.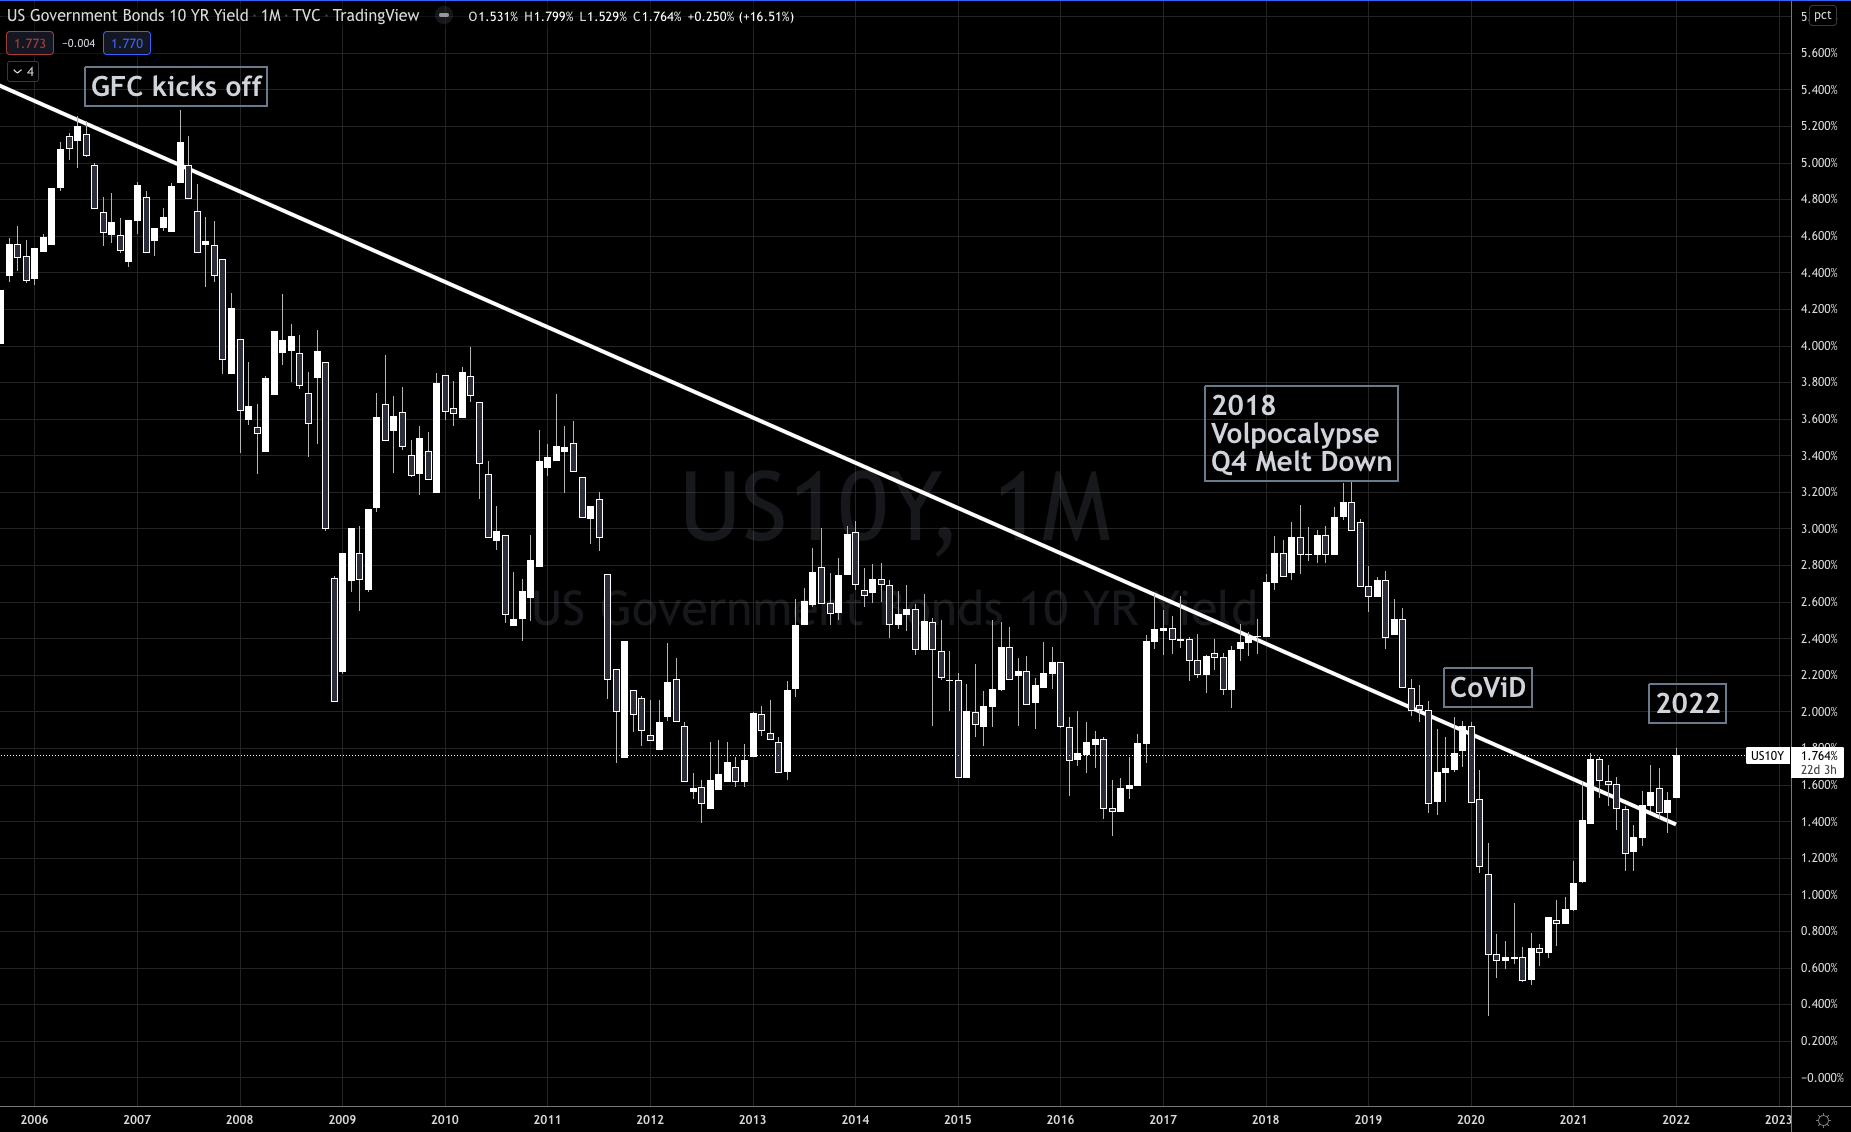
I'm not predicting a Global Financial Crisis, 9/11 or CoVid based on a trend line, but I focus on market regimes to guide my analysis and how I approach markets.
There are a plethora of tools to understand the market regimes.
A big one is happening right now, the repricing of risk in institutions financial models.
We are in an environment when big money is planning on or is currently in the process of slowly and systematically restructuring their market exposures, since it is interest rate influenced, either directly or not, it isn't just one institution, it's all of them, at the same time.
In that sort of environment (market regime) bad news can really force these slower moves to accelerate, meaning markets can move very quickly on bad news.
We have to assume that all the known bad scenarios are already price into the markets, and this environment is where surprises usually resolve to the down side. Something we don't know about is what we need to be on the look out for, or something we do know about but are misinterpreting the effects.
Speaking of trend lines, the $NQ (Nasdaq 100 Futures) closed the week below the diagonal upward trend line on Friday. 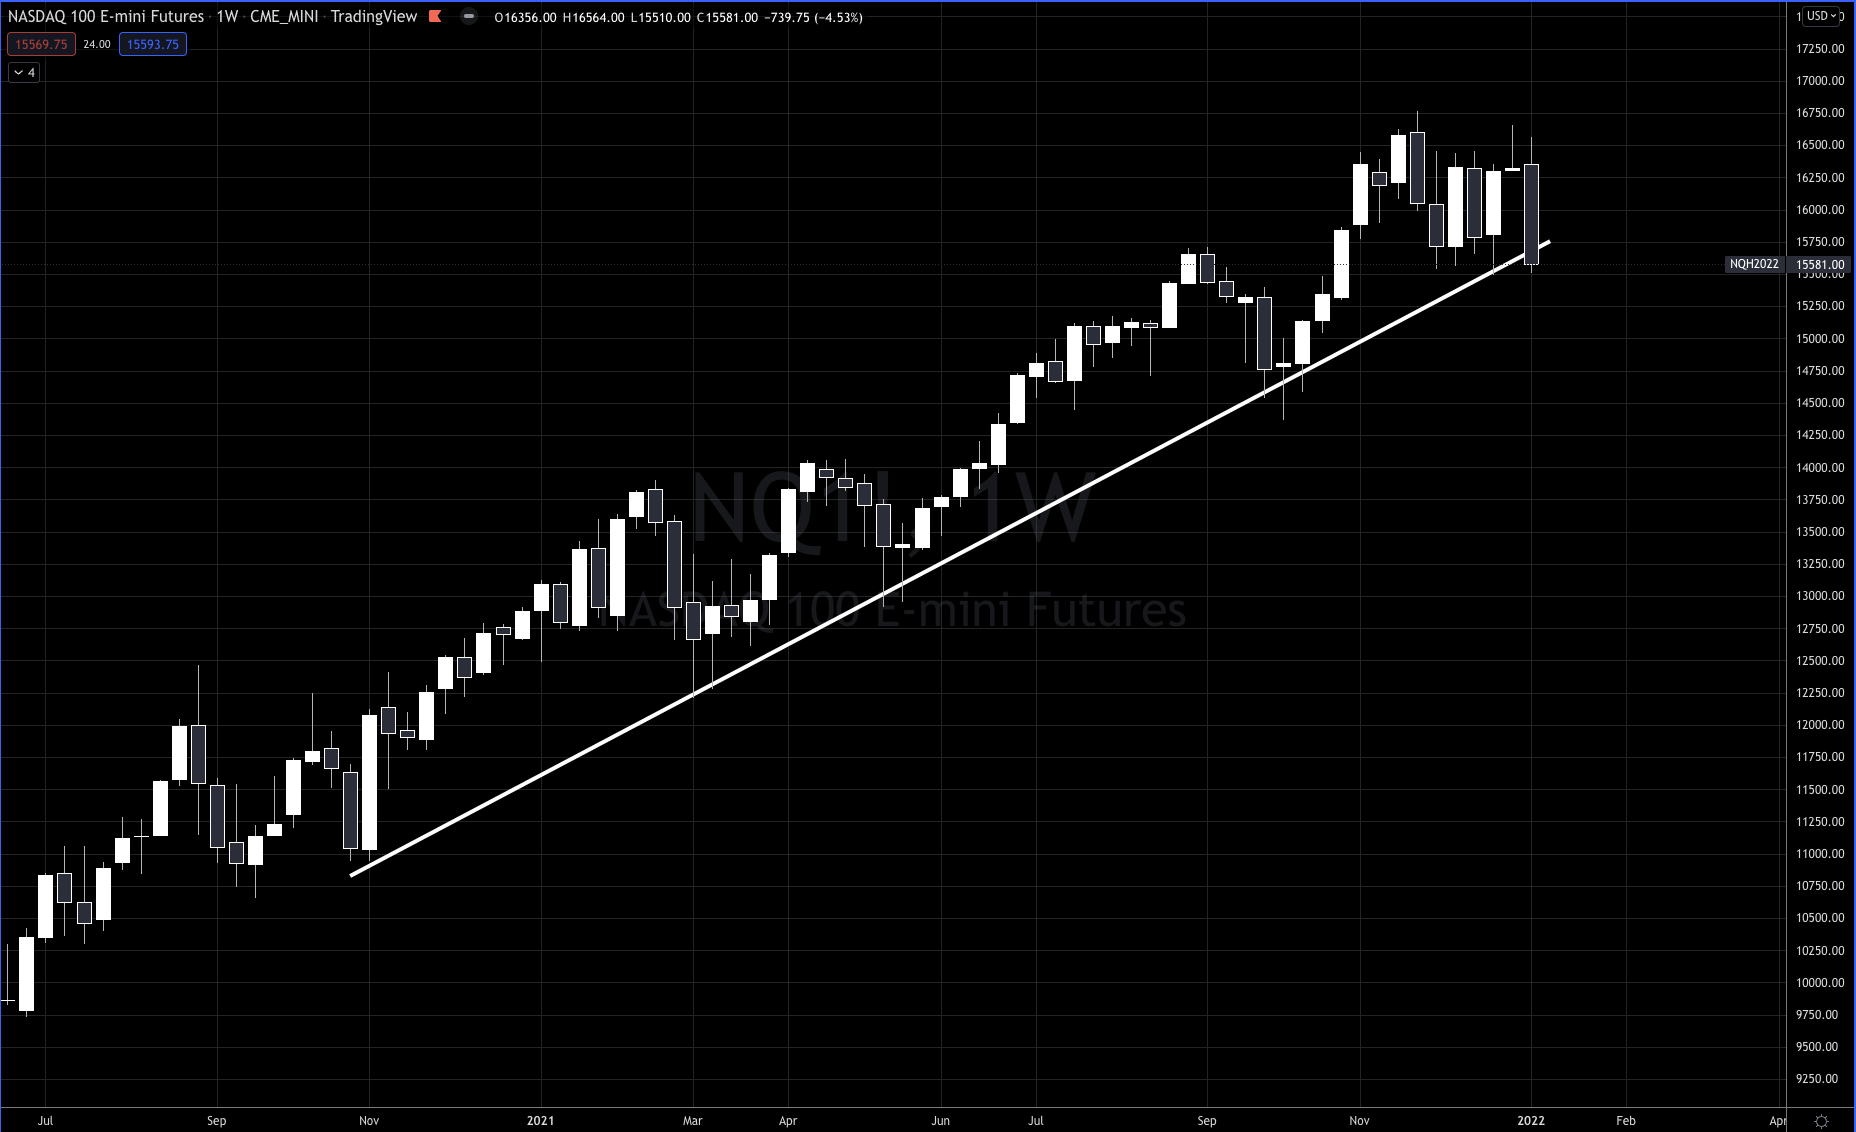
Normally I don't care about diagonal trend lines because they are more subjective (like Elliot Wave (hah!)) than horizontal lines. However this one has been respected 5 times since September 2020, giving it more reliability than other trend lines.
Now for horizontal trend lines, support/resistance, I give that a lot more respect, and wouldn't you know it, we are testing the lows of the week of December 20 with a potential reverse Head and Shoulder pattern in a neutral market regime.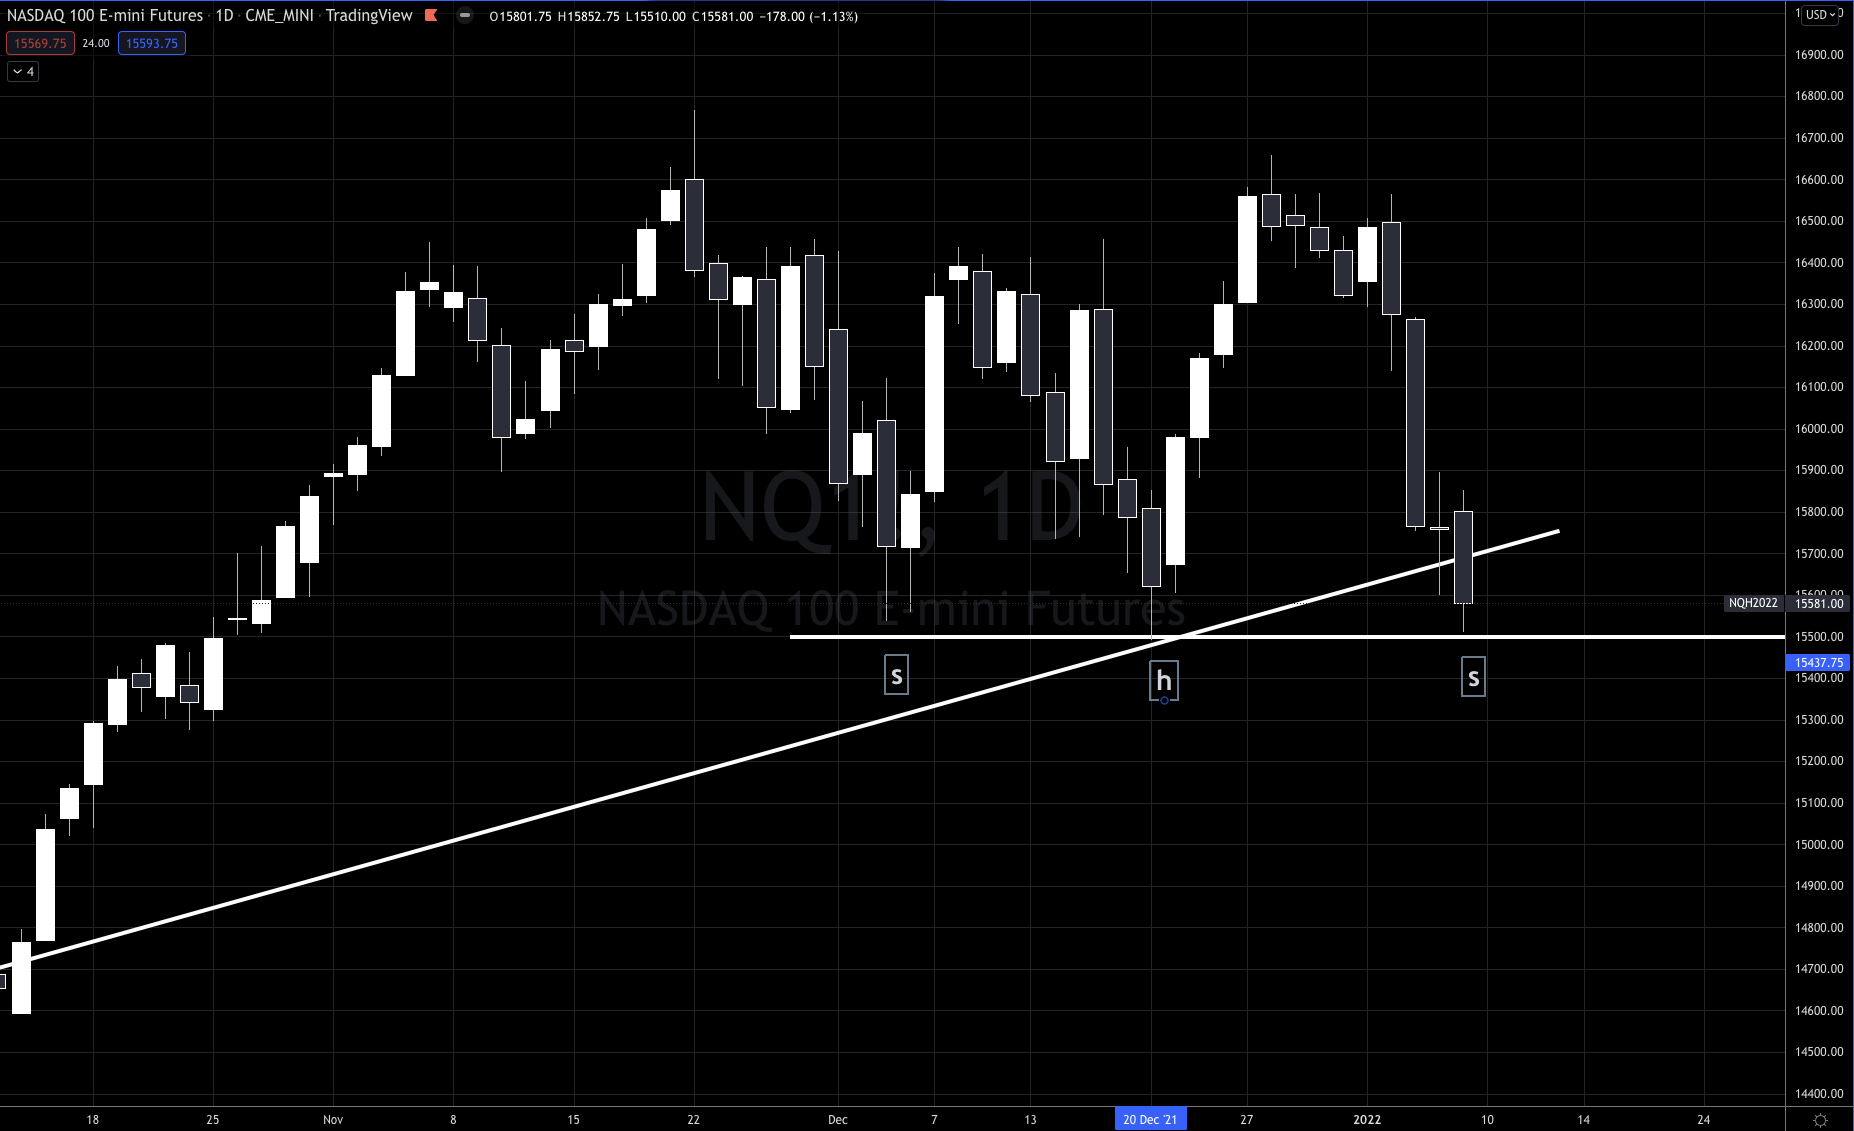
If! If, If $NQ can hold and get above Fridays high we have an opportunity to move higher from here, either trading in a range for a while or taking on the task of making more new all time highs!
If! If, If $NQ can't hold then there isn't a lot of support until around 14,947 on $NQ futures or even down below 14k.
Personally I have a Straddle on $QQQ's (Nasdaq ETF) where I'm long both deep out of the money Calls and Puts. These are smaller than normal positions because I'm only looking to protect extreme moves.
Meanwhile our Swing Beast Momentum Strategy has me long $KO (Coca Cola)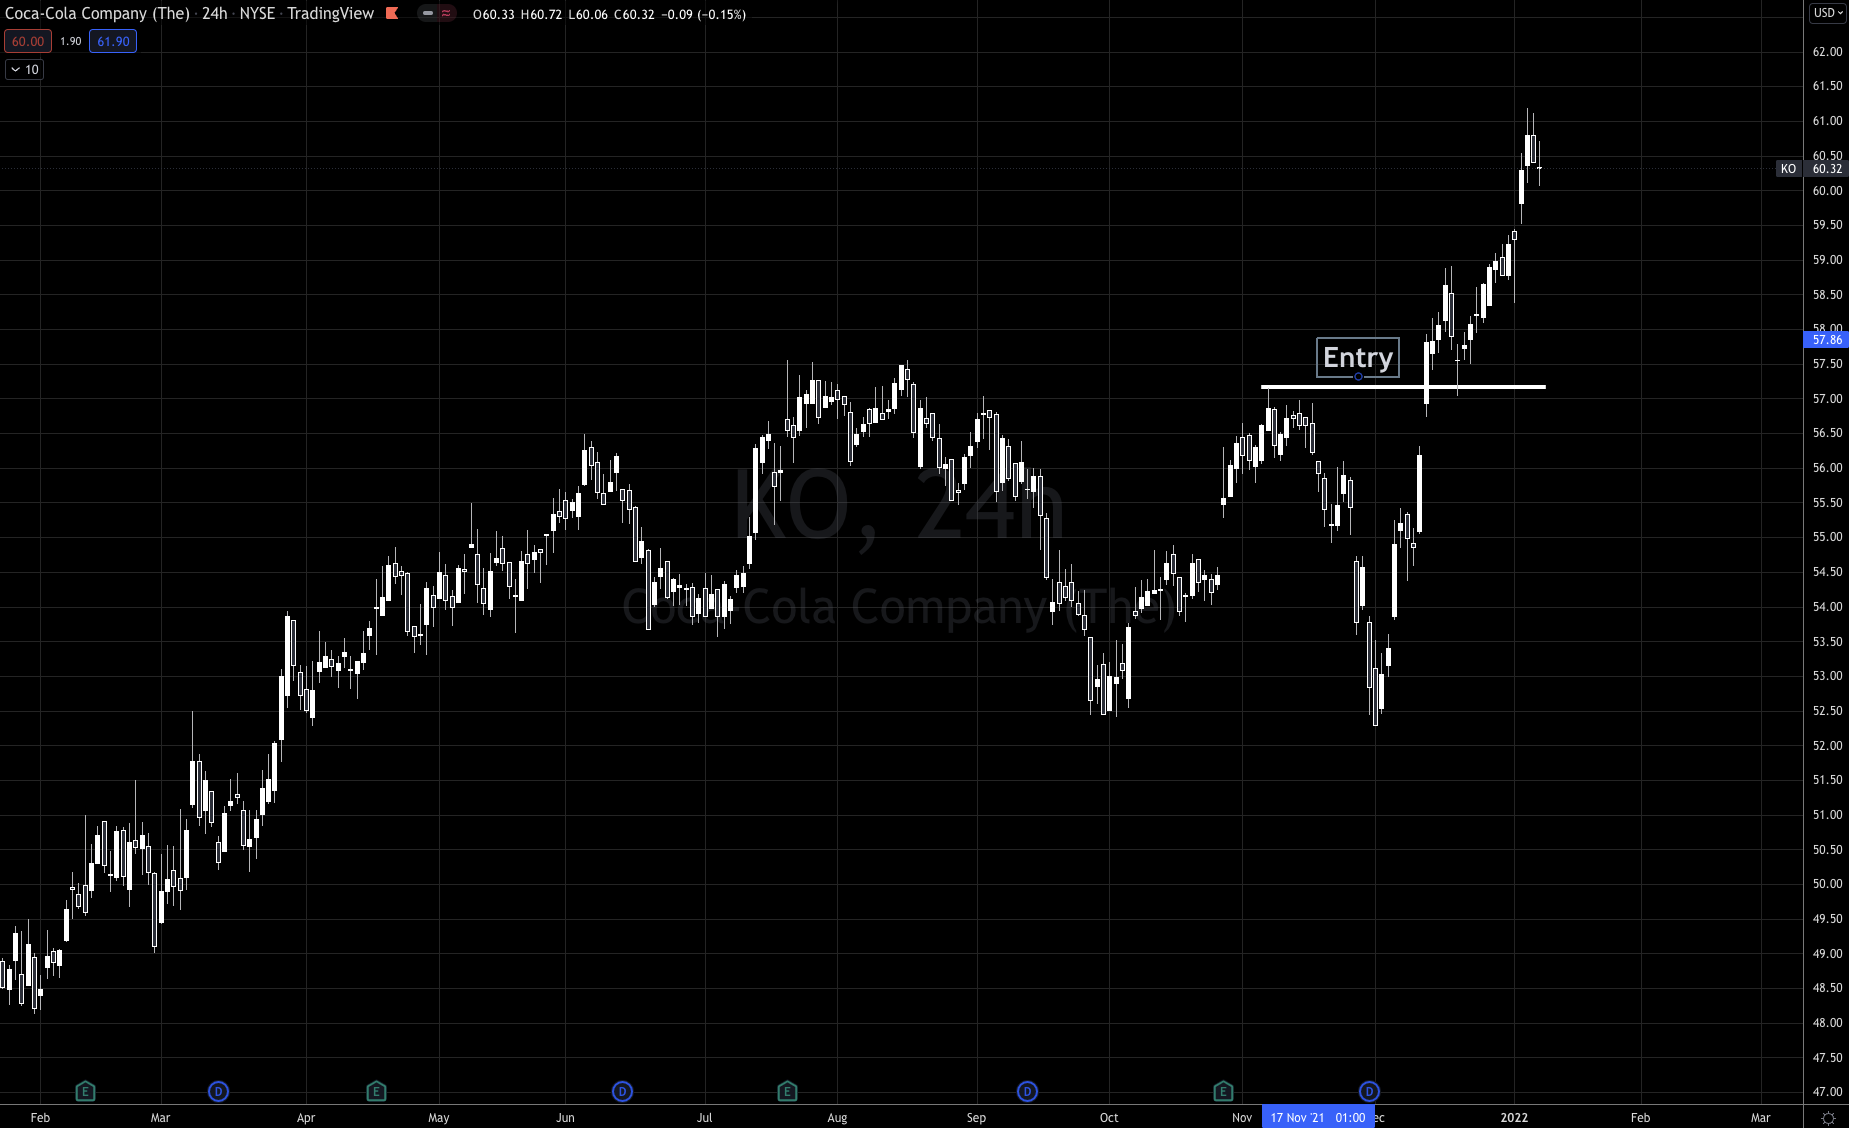
$F (Ford)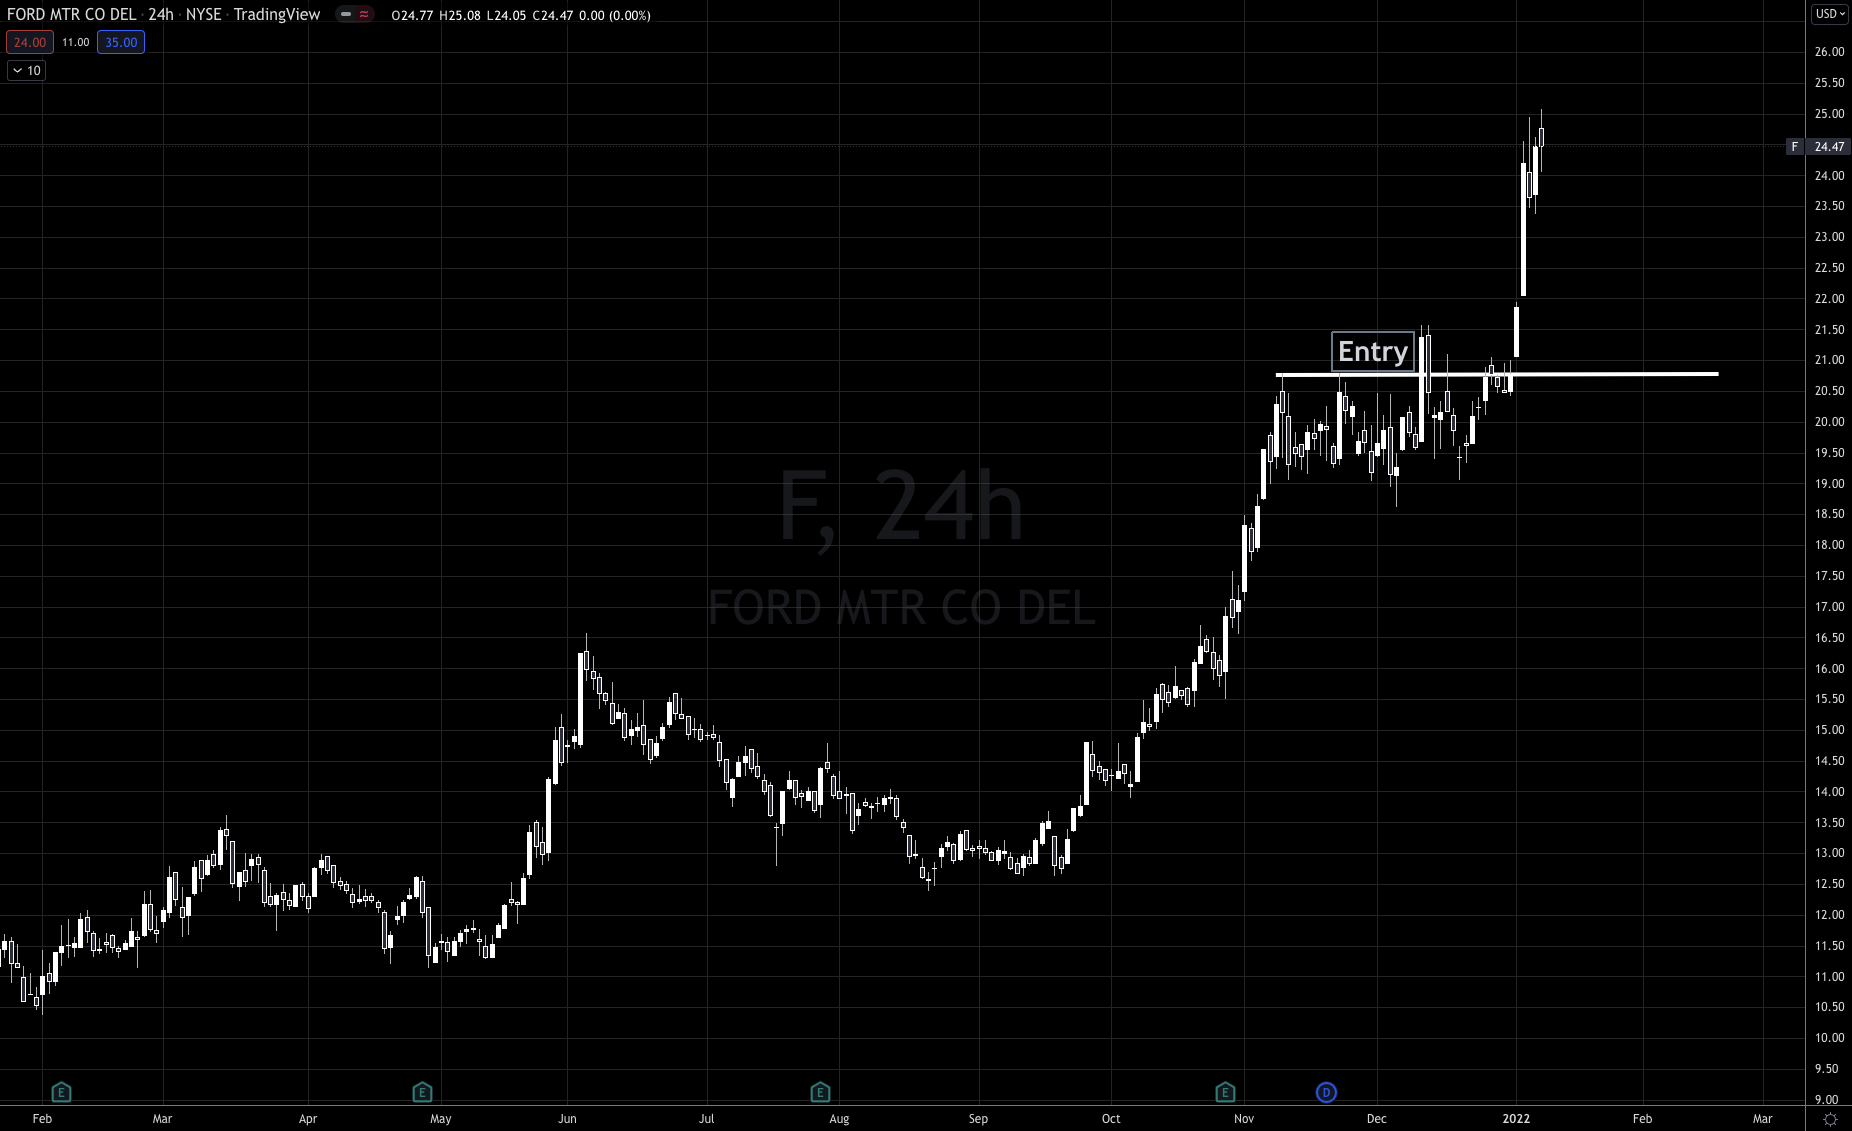
$TGT (Target)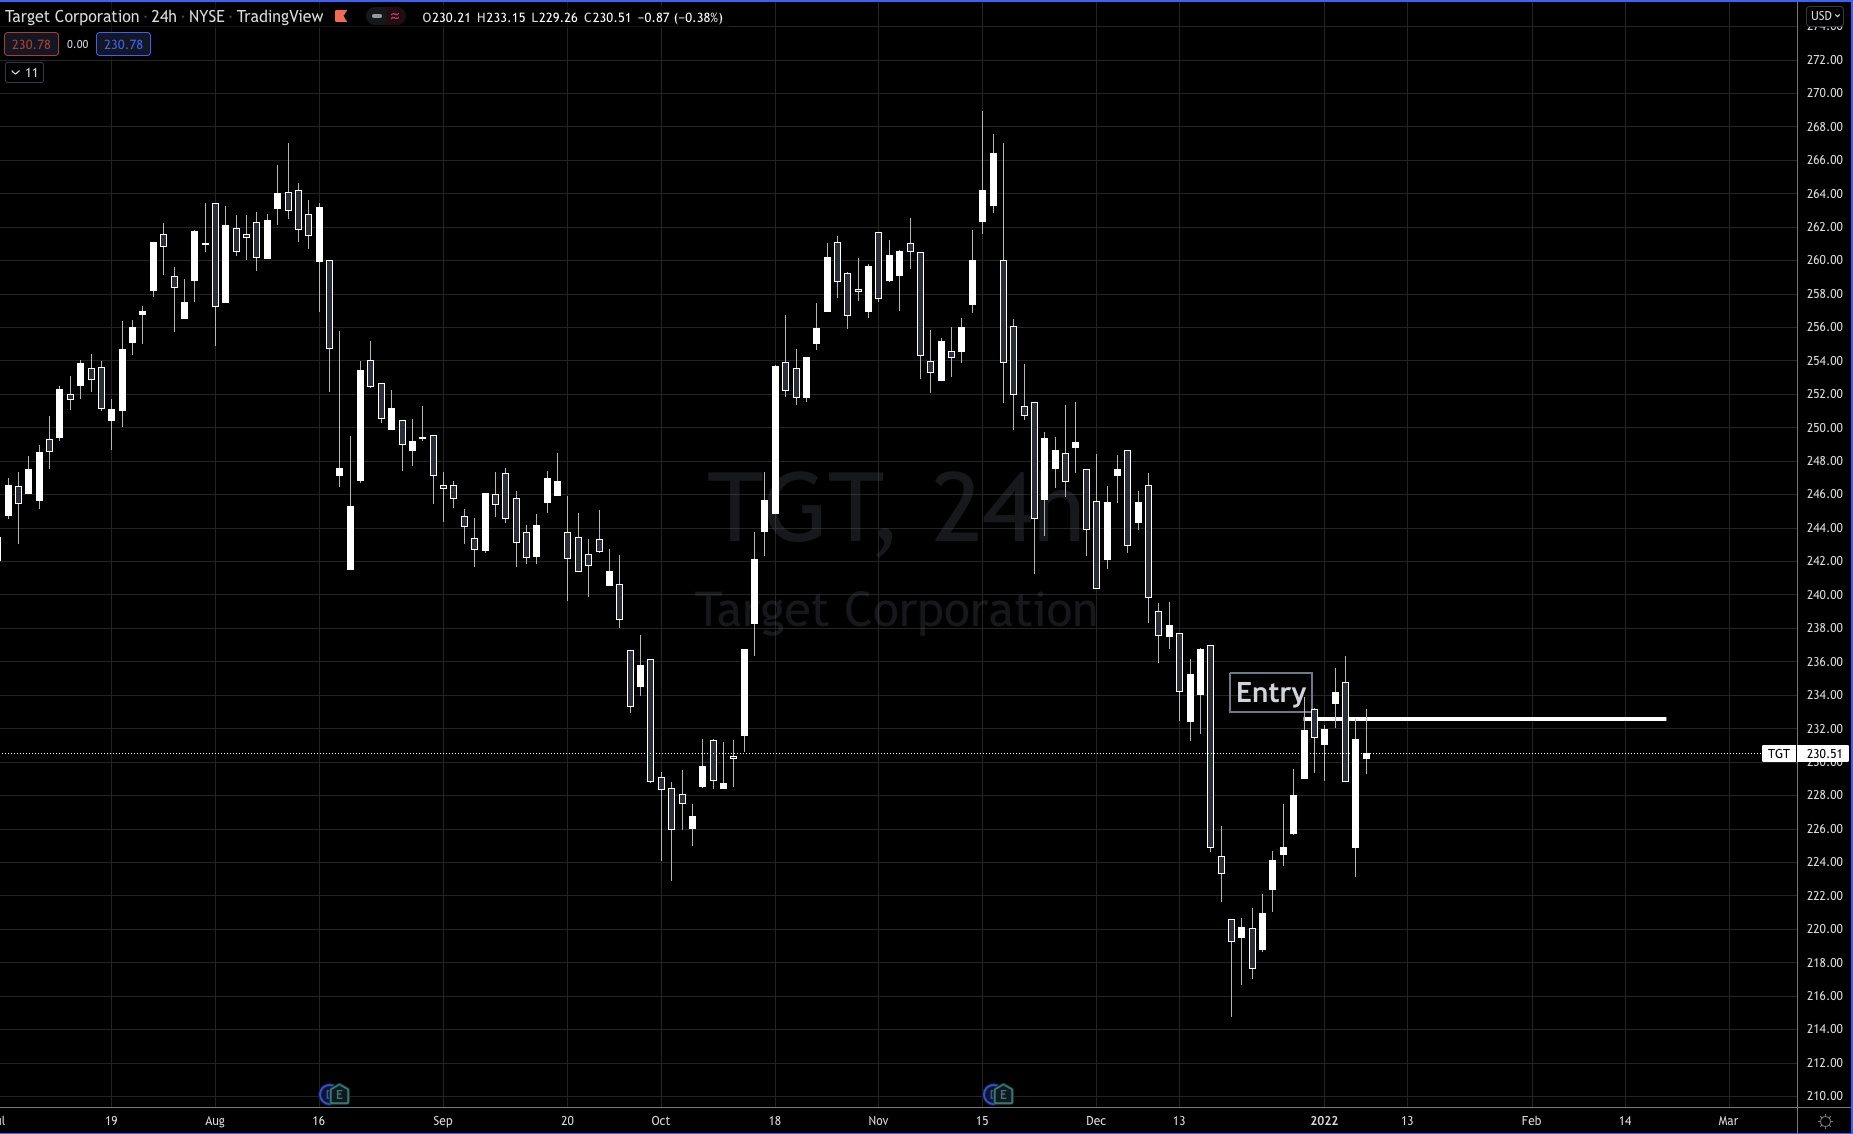
Right now Energy, Financials and Consumer Staples are all looking strongest with tech and consumer discretionary taking the majority of the heat.
You can get access to the Swing Beast Momentum Strategy here if you are interested in catching some real bangers!
Lastly, I'm keeping a close eye on currency markets. With rates going higher, that will have a major response to global currencies and we can expect a lot more action in FX this year, it would seem.
The $GBPJPY (Pound Yen) pair has been an animal for us since the summer of 2020 and we continue to expect $175 to $200 levels.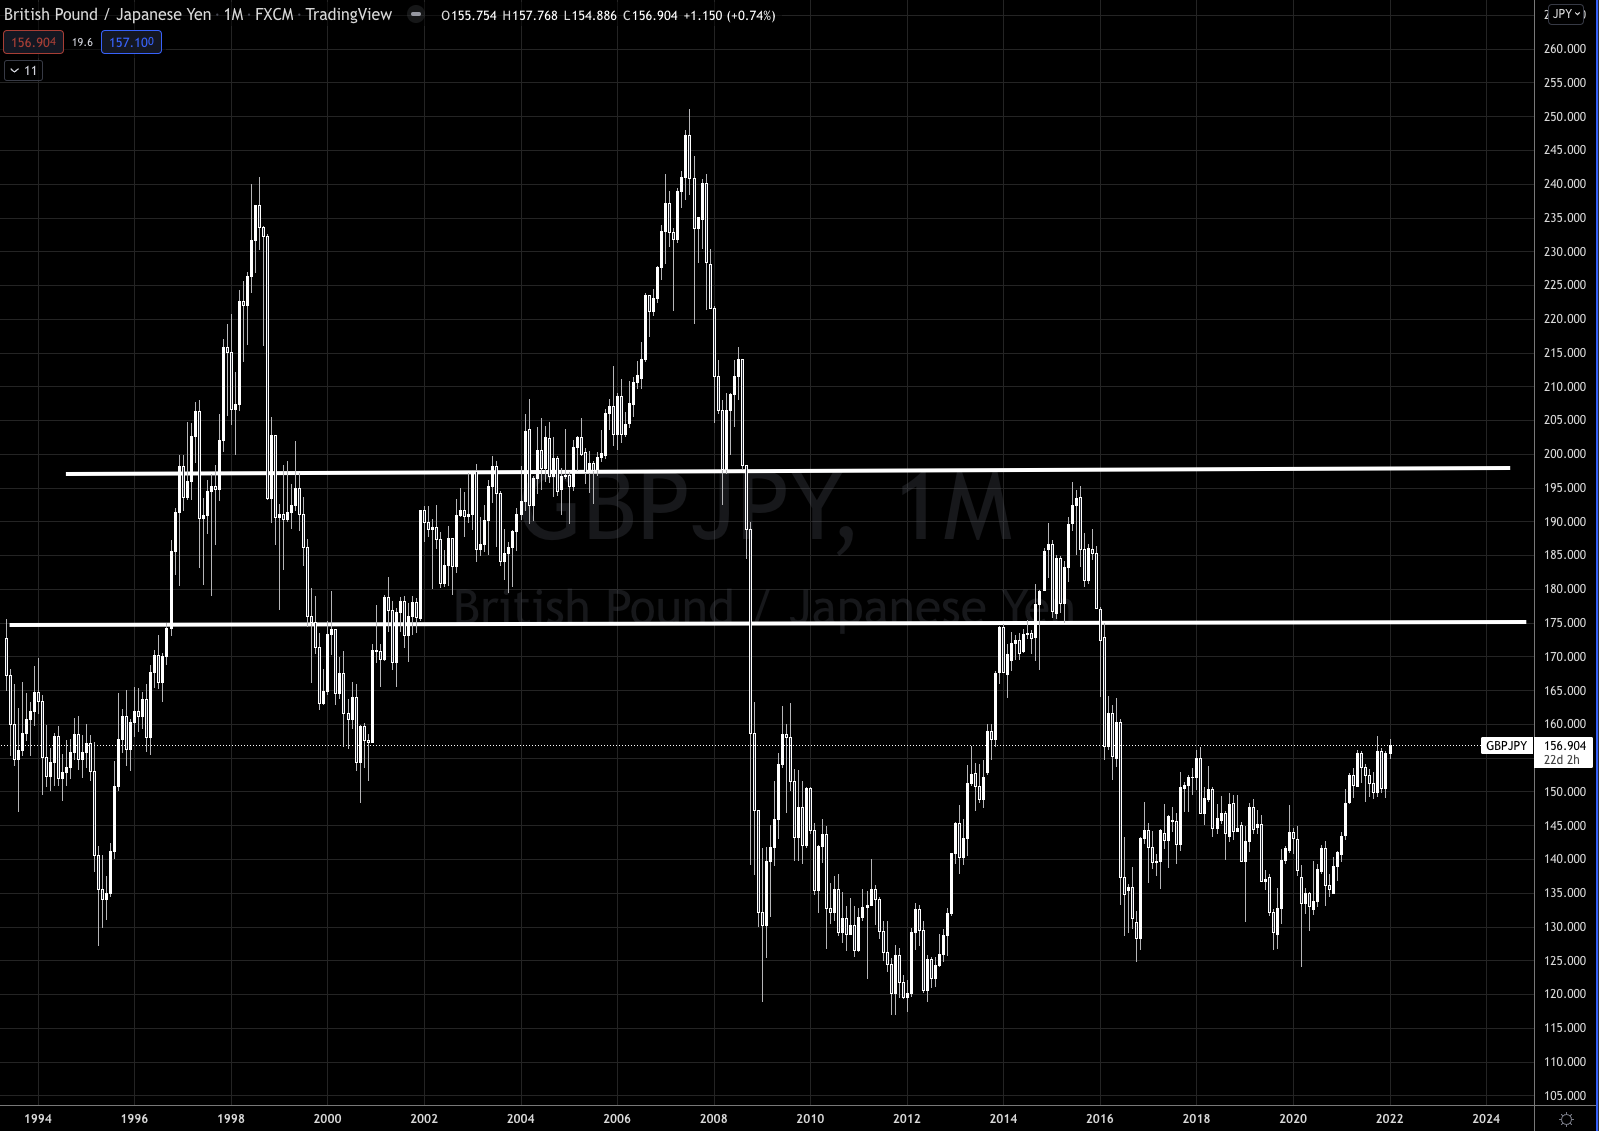
Stay connected with news and updates!
Join our mailing list to receive the latest news and updates from our team.
Don't worry, your information will not be shared.
We hate SPAM. We will never sell your information, for any reason.
