
Weekly Market Overview December 19, 2021
Dec 18, 2021You can't turn on CNBC (and you shouldn't watch that garbage), or read any market commentary this month without hearing the reference to "The Santa Claus Rally" as if it's a given that the stock market will just go up, no matter what, in December.
It's even more frustrating when it doesn't go up in December, like they promised you!
There is actually a very quantitative approach to measuring and trading the end of year.
Usually attributed to tax loss harvesting, selling losing positions before the end of the year to be able to take the tax credit against this years capital gains. Since trading volume USUALLY drops to the lowest daily averages of the year during the last week or two in December, most selling happens the first half of the month.
Also, people are on vacation, traveling, with family and generally don't want to focus on the markets.
After this selling pressure dies, there's another event that hits the markets, every quarter and that's the Quad Witching event, which refers to a date when stock index futures, stock index options, stock options, and single stock futures expire simultaneously...this happened this past Friday December 17.
Historically, buying the market, in this case let's use the $NDX (Nasdaq 100), after quad witching and in the last two weeks of the year, then selling the January open produces the best results.
Particularly if you buy 3 trading days before Christmas and sell 8 days later, this would generate the most profit for you.
h/t@QuantifiableEdges on Twitter or https://www.quantifiableedges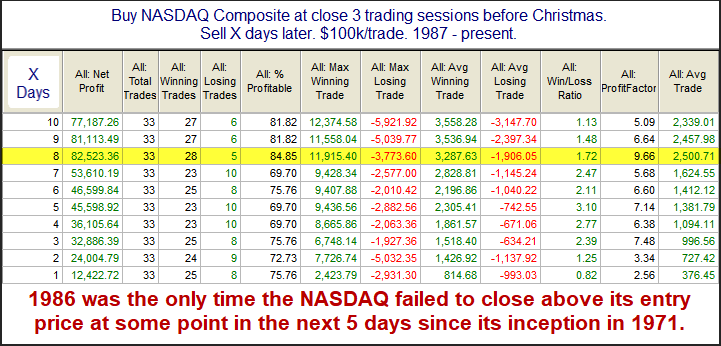
This year that would be buying $NQ $QQQ (or whichever iteration of the Nasdaq) on December 21st (December 24th is not a trading day this year) and selling 8 Trading days later.
We can also look at Larry Williams Trading Days Left in Month for December which buys the $SPX X number of trading days before the end of the month.
h/t @SethGolden on Twitter or at Finomgroup.com for sharing this one.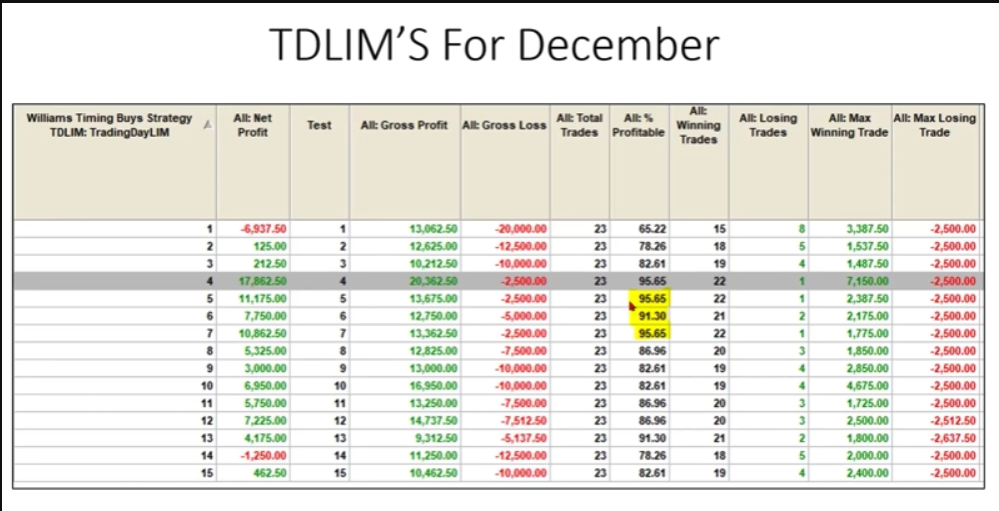
If we look at a seasonality chart going back to 1997, we can see that the $DJIA performs strongest from October in to the end of the year (minus a few hiccups along the way).
h/t @McClellanOsc on Twitter or at https:/www.mcoscillator.com for this one.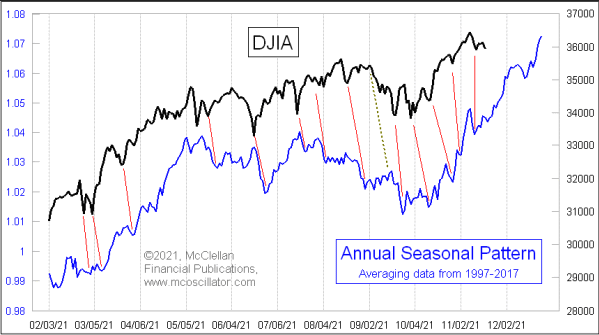
Clearly we have seasonality and statistics in our favor, with around an 80%+ win rate, all signs point to buy buy buy!
But if you know me, you know I'm going to pay attention to the Market Regimes first and foremost.
Let's have a look at what regime the indices are in as we head in to the last part of 2021 as measured by the SQN Indicator or learn more about it here.
$NQ = Bull Quiet/Neutral
$ES = Bull Quiet
$YM = Neutral
The Neutral/Bull Quiet Market Regimes are suggesting we should be looking to prices resolving higher.
All of this data is clearly suggesting prices have to go higher and they very well might, but I'm not going to buy simply because statistics and seasonality suggest that it'll happen 80% of the time.
I'm looking for the best looking sell setups, in the world, to fail!
We certainly have a market environment that is very open to bearishness right now, which is how we will be setting up for another long opportunity, regardless of Santa Claus and all his statistics.
Among the traders that I chat with during the trading day/week a number of them have been talking about two worrisome charts.
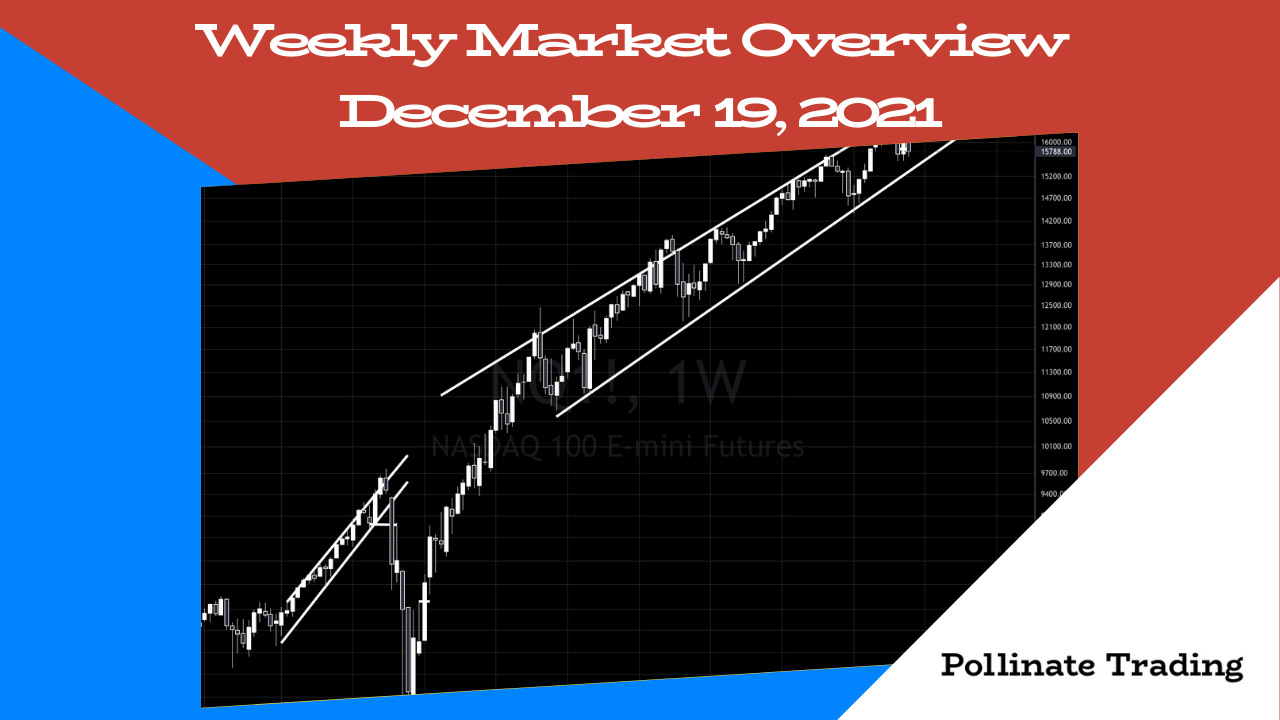
The first is the $NQ Weekly chart here. I'm not a fan of diagonal trend lines because they are far too subjective, at least horizontal trend lines actually represent a price that was traded, diagonal lines don't. However these diagonal trend lines are important, because a lot of other traders use them, which does play well when the best sell setup in the world fails, type of trading.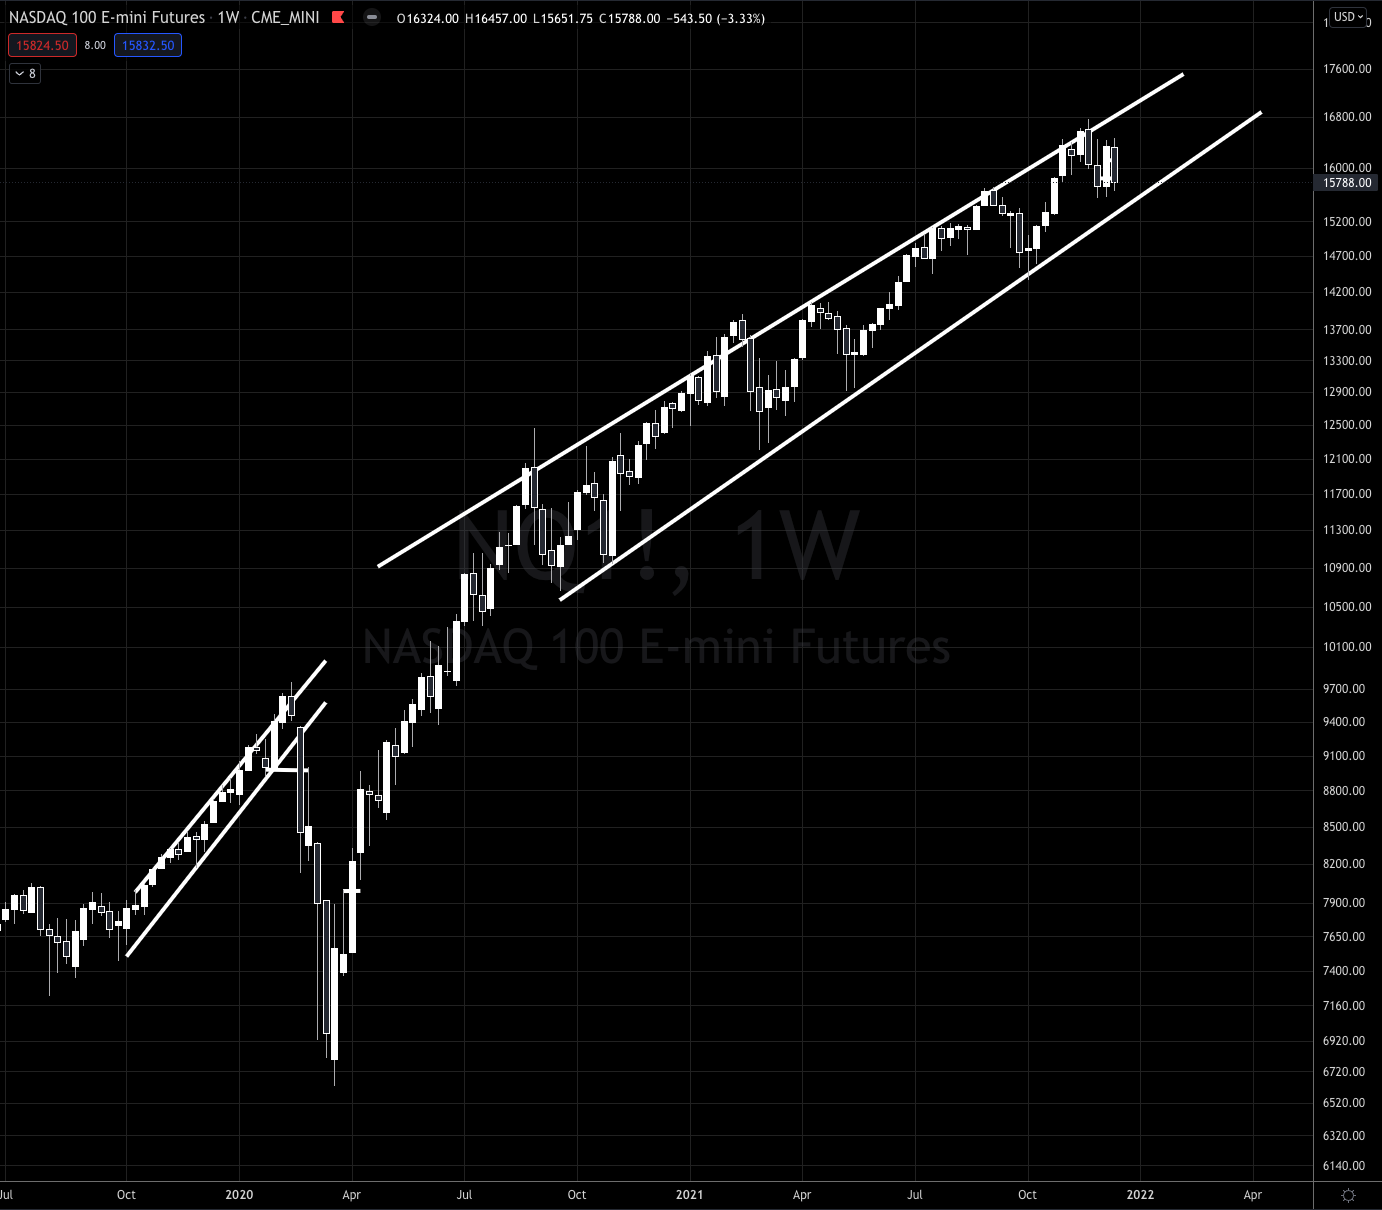
In this weekly $NQ chart you can see that every single time price gets above or touches, that top trend line, it quickly drops down to the bottom trend line, then reverses to drift higher before repeating that cycle over and over.
Every single time that price dropped, it was indeed the best looking sell setup in the world. And every single time, that sell setup failed, and price went higher.
If I add the horizontal lines that I'm more fond of, I clearly see that every price level breakout is retested. Price breaks out and seeks a new level, then backfills to test the new breakout levels, if it holds as support then that's normal market behavior.
This pullback over the past four weeks, then, is normal market behavior. 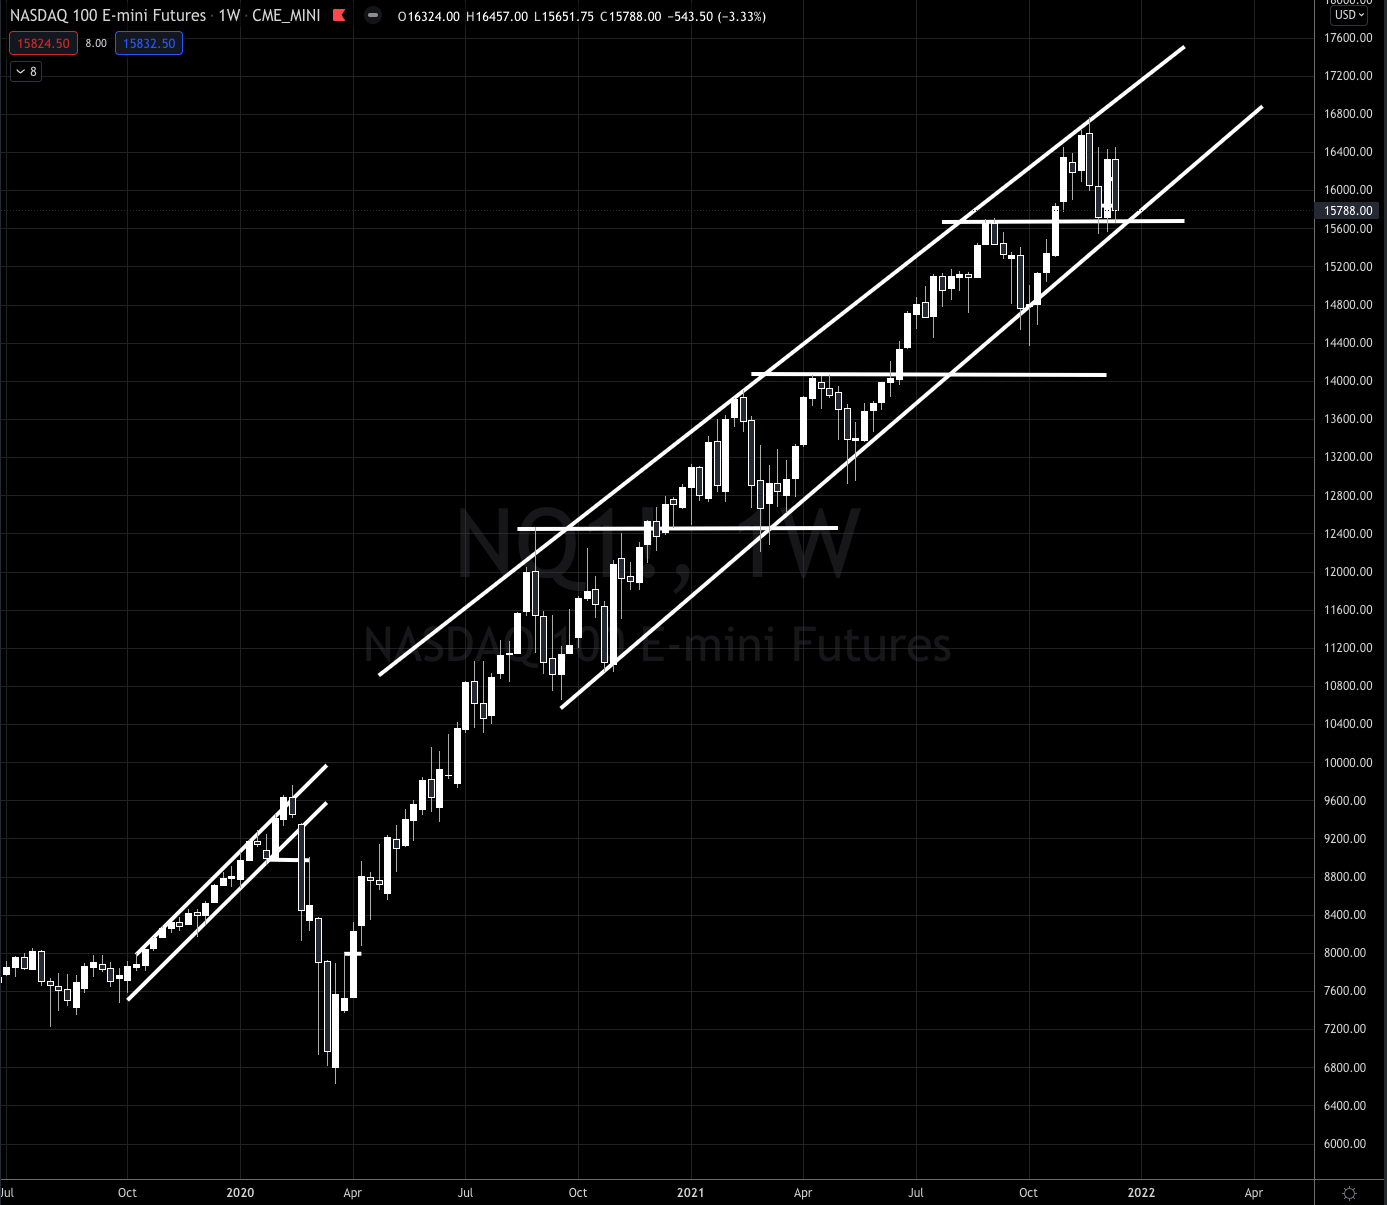
And the last chart that I've been getting sent is the Head and Shoulder top on $NDX.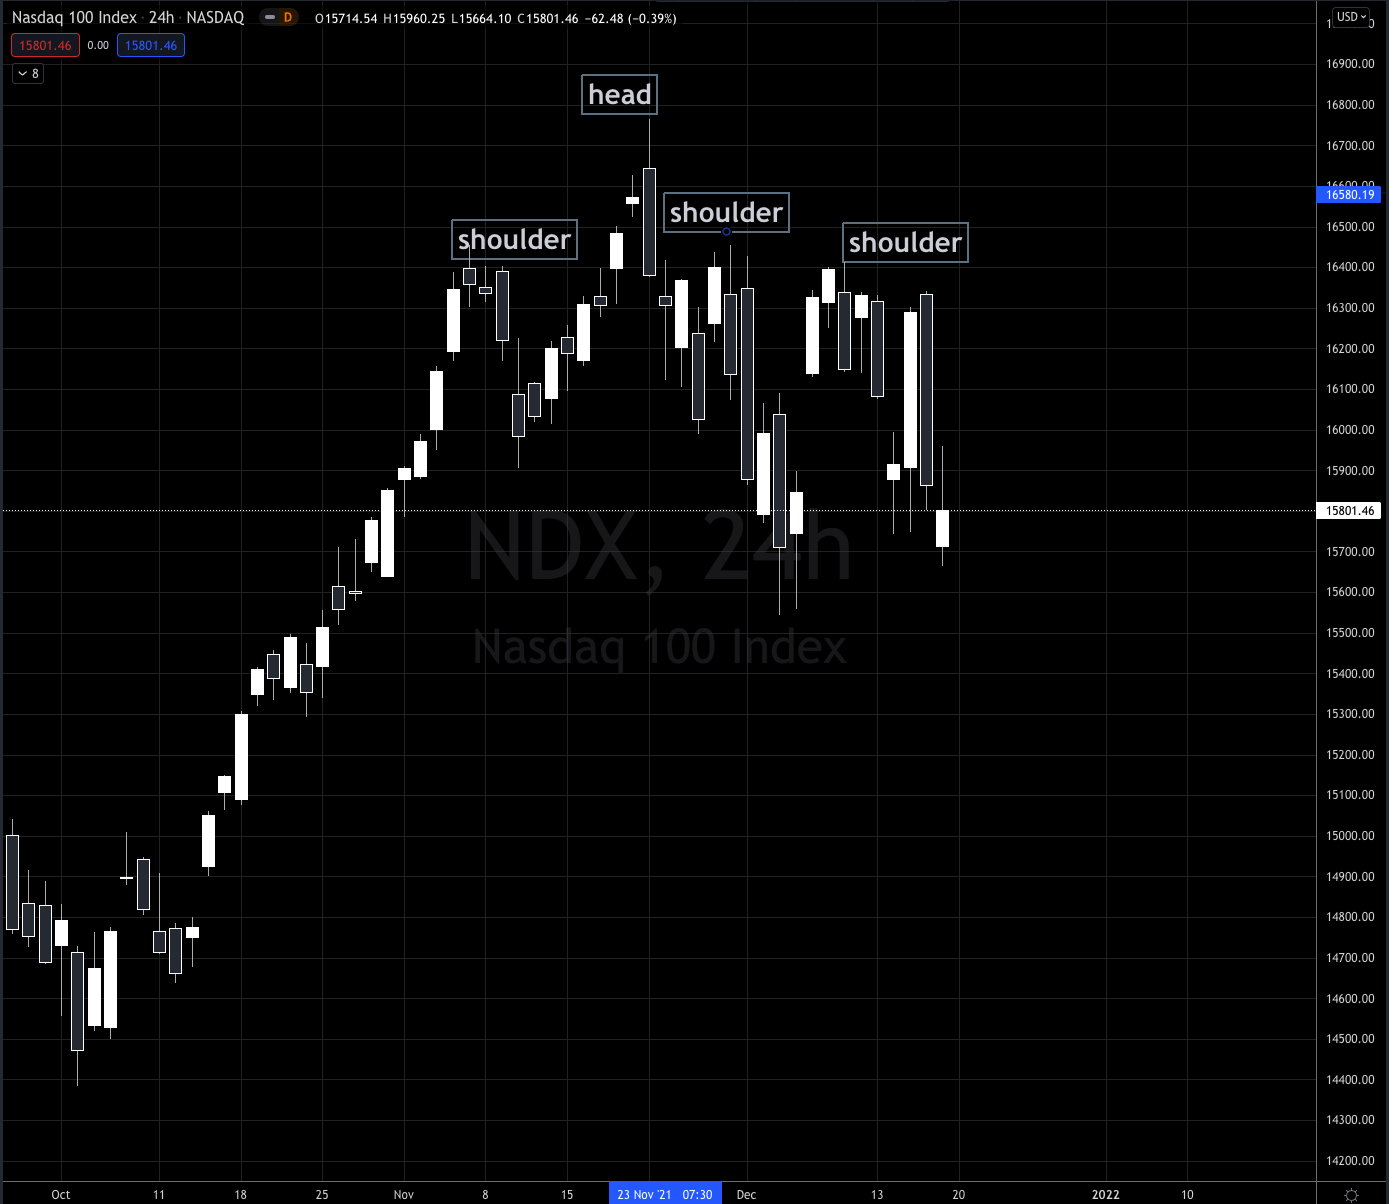
I share all of this, not because I make trading decisions off of trend lines or chart patterns, but because a boat load of market participants do.
In essence with everyone sharing these trend lines and head and shoulder chart patterns traders will take positions ahead of confirmation, without using proper risk management. This forces the initial reactions and sucks everyone in who thinks theirs $SPY puts that they've been buying month after month, are finally going to pay off.
They might, but in this regime, that is a very high risk/low return probability.
And if it is, by chance, the big one, then I will miss that lucky entry short, and instead will wait for the high probability setups that are tradable.
This is what drives markets, everyone is always thinking that they are catching the markets right at the absolute perfect entry to their narrative, bullish or bearish.
Instead of constantly trying to guess what the market is going to do, wouldn't you rather be in the right stock or market at the right time and staying on the sidelines when there's nothing but BS and chop?
Check out the Swing Beast Momentum Strategy.
It is an absolute killer catching big powerful moves, like $AAPL and $PFE recently.
We finally closed out of the long $AAPL position's we put on in November and the beginning of December, while the $PFE trade is still pushing higher!
As these markets react to all that I wrote about earlier with the Nasdaq, holidays, trend lines, headlines and everything else, Swing Beast will be setting up for another opportunity to reload and catch another round of multi XXX% move's higher.
And those of us trading that strategy will be able to enjoy our holidays with our family without worrying constantly about markets!
Get ready!
Stay connected with news and updates!
Join our mailing list to receive the latest news and updates from our team.
Don't worry, your information will not be shared.
We hate SPAM. We will never sell your information, for any reason.
